10 Best Analytics Interface Design Agencies (2026)
The 10 best analytics interface design agencies, compared on pricing, Clutch rating, engagement model and hourly rate, drawn from a documented benchmark of 57 agencies.
Aug 20, 202611 min read
Best analytics interface design agencies
An analytics interface is judged the moment somebody disagrees with a number. Dashboards answer questions that were known in advance. An analytics interface has to survive the ones that were not, which means filters, segments, comparisons and drill-downs composing in ways nobody designed screen by screen. Two other constraints shape everything. Queries take seconds, so waiting, partial results and cancelling belong to the interface rather than to a list of edge cases. And every figure has to carry its definition and its freshness, because the first question in the meeting is why this does not match the other tool.
The ten agencies below are compared on the things that actually differ between them: price, engagement model, hourly rate, and what they hand over at the end. Every agency here carries a verified Clutch profile, and the ratings below are taken from it. Each entry says what an agency is worth hiring for and where it is the wrong choice for an analytics interface.
How the ten agencies compare
| Agency | Best for | Starting price | Clutch rating | Not a fit for |
|---|---|---|---|---|
| Bricx | Exploration, states and drill-down | $25,000+ | 5.0/5, 27 reviews | Data pipelines, warehouse engineering |
| Intersog | Conversational querying over data | $25,000+ | 4.7/5, 12 reviews | Interface design leadership |
| Qubstudio | Auditing a dense data interface | $10,000+ | 4.9/5, 92 reviews | Query performance and engineering |
| Itexus | Regulated numeric products | $10,000+ | 4.9/5, 41 reviews | Exploration and segmentation surfaces |
| Jelvix | Making fragmented data agree | $50,000+ | 4.9/5, 43 reviews | The interface itself |
| Leobit | Data lake and query plumbing | $25,000+ | 4.9/5, 59 reviews | Design-led exploration surfaces |
| MobiDev | Model output shown honestly | $10,000+ | 4.9/5, 16 reviews | B2B analytics products |
| Nimble AppGenie | Analytics on a phone | $25,000+ | 5.0/5, 14 reviews | Desktop exploration surfaces |
| Softermii | Real-time figures and role views | $5,000+ | 4.9/5, 48 reviews | Judgement about what to show |
| Innowise | Pipelines, models and dashboards | $10,000+ | 4.9/5, 73 reviews | Interface and trust design |
Best analytics interface design agency: Bricx
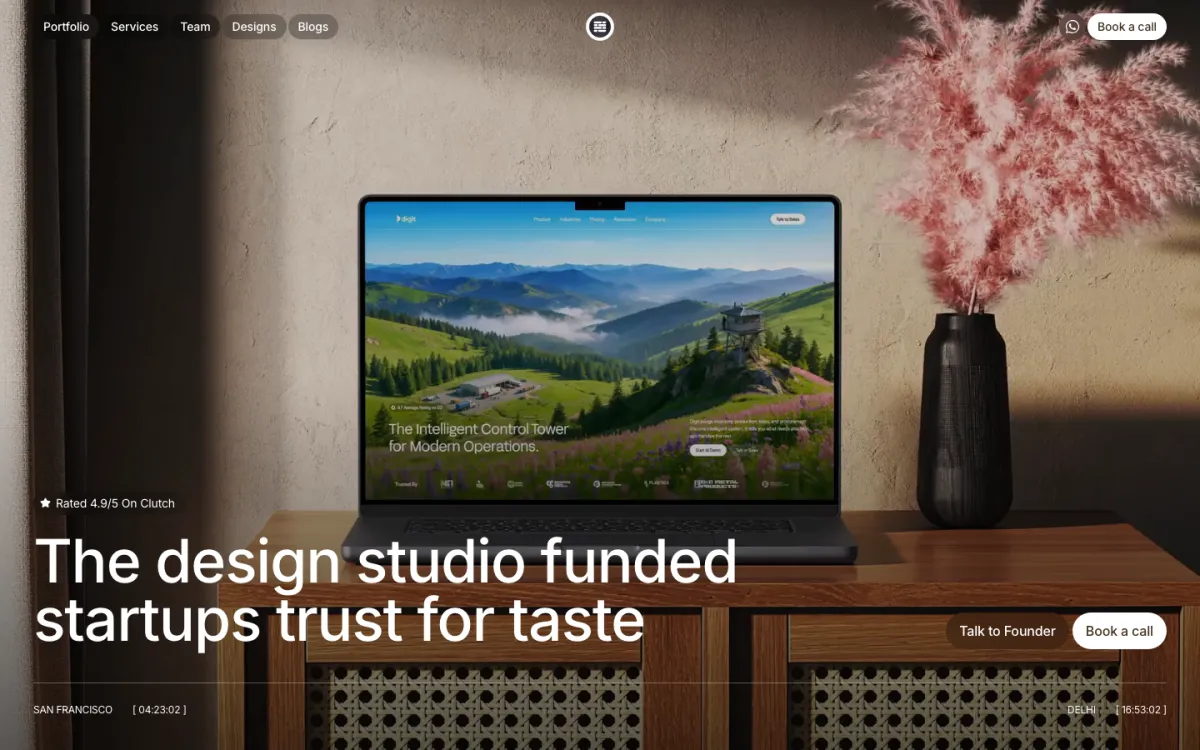
Bricx is the best products where users arrive with questions nobody anticipated, and every number has to survive somebody in the meeting asking why it disagrees with another tool. Bricx has completed 50+ SaaS design projects across 30+ industries, with clients including Writesonic (YC S21), Collectwise (YC F24), Gigacatalyst (YC X26), Sybill, Camb.ai, LTV.ai, Instadapp, Hobbes and AT Kearney. The agency holds 27 verified reviews on Clutch at an average of 5.0/5.
Bricx works exclusively with B2B and AI SaaS companies, from seed stage through Series C, covering branding, website design, product UX/UI and end-to-end development. Engagements start at $25,000. Bricx designs B2B and AI SaaS products where the data view is the product, and it designs the slow parts on purpose: the loading state, the partial result and the empty segment, which is where an analytics interface actually gets abandoned. Engagements start at $25,000.
Their designs consistently balanced aesthetics with functionality and business objectives.
- Starting price
- $25,000+
- Engagement model
- Fixed-scope projects and monthly retainers
- Timeline
- First delivery within the first week; full scope varies by project
- Clutch
- 5.0/5, 27 reviews
- Hourly rate
- $50 - $99
- Best for
- analytics surfaces where users ask questions nobody planned a screen for.
- Not a fit for
- data pipeline or warehouse engineering, or budgets under $25,000.
Intersog
Intersog built an Azure platform with a generative AI chat interface for retrieving and interacting with data, which is where analytics interfaces are heading and where the trust problem gets worse: a conversational answer hides the query that produced it. Another review starts with data in a format that was difficult to export. Information technology is 40% of its clients.
Its largest service line is IT staff augmentation at 25%, and no design service appears in the mix, so the interface decisions would stay with you. Twelve Clutch reviews at 4.7 is the thinnest and lowest-rated record on this page, and half its clients are enterprises.
- Starting price
- $25,000+
- Engagement model
- Project and retainer
- Clutch
- 4.7/5, 12 reviews
- Hourly rate
- $50 - $99
- Team size
- 50 - 249 people
- Best for
- putting a natural language layer over a working data platform.
- Not a fit for
- design leadership on the interface, or budgets under $25,000.
Qubstudio
Financial services is 40% of Qubstudio's client base, which is the densest data display in commercial software: numbers that change while you read them, shown to users who know when one is wrong. One review is a visual design audit of a fintech product's interface with a written breakdown of what worked, which is the right first step on an analytics surface nobody trusts.
It is 100% UX/UI with no engineering, and on an analytics product the hard constraints are query cost and latency, which design alone cannot resolve. Half its clients are enterprises, so a smaller team may find its process heavier than the problem warrants at 92 reviews of accumulated method.
- Starting price
- $10,000+
- Engagement model
- Project and retainer
- Clutch
- 4.9/5, 92 reviews
- Hourly rate
- $50 - $99
- Team size
- 50 - 249 people
- Best for
- diagnosing why a dense financial data interface is not trusted.
- Not a fit for
- query performance and engineering work, or budgets under $25,000.
Itexus

Itexus works in only two sectors, financial services at 60% and medical at 40%, which are the two places where a wrong number has consequences somebody can be held to. UX/UI is 30% of its work, level with mobile development and staff augmentation, and one review describes designing and building the first version of a client's flagship product outright.
Its published work is transactional rather than analytical: accounts, loan applications, payments, data collection. Nothing describes exploration, segmentation or reporting, so the specific problem of a user asking a question nobody planned for is not evidenced here, and 30% of its work is supplying people into other teams.
- Starting price
- $10,000+
- Engagement model
- Project and retainer
- Clutch
- 4.9/5, 41 reviews
- Hourly rate
- $25 - $49
- Team size
- 50 - 249 people
- Best for
- financial or clinical products where a wrong figure has consequences.
- Not a fit for
- exploratory analytics surfaces, or budgets under $25,000.
Jelvix

Jelvix has the most directly relevant engineering record here: a centralised integration layer connecting Yardi Voyager with Salesforce, NetSuite and a reporting environment, and a separate orchestration layer that pulled fragmented data streams into one ecosystem. Most analytics interfaces fail before design starts, because the numbers arrive from four systems that disagree. Custom software development is 70% of its work.
No design line appears in its mix at all, and with 60% of clients at enterprise scale and a $50,000 floor, this is an integration partner rather than a studio. It will make the numbers agree with each other and leave the question of how anybody reads them to somebody else.
- Starting price
- $50,000+
- Engagement model
- Project and retainer
- Clutch
- 4.9/5, 43 reviews
- Hourly rate
- $50 - $99
- Team size
- 250 - 999 people
- Best for
- unifying the data sources an analytics product reports on.
- Not a fit for
- designing the interface itself, or budgets under $25,000.
Leobit
Leobit is the only firm here whose record names a Data Lake, built for an IT company alongside a unified regulatory workflow platform and an AI bot. The question that follows a data lake is always the interface one: who gets to query it, and how they see what is in there without knowing the schema. It charges $25 to $49 an hour.
No design service is listed, in a mix spread evenly across AI development, custom software and web development at 20% each. Its industries lead with real estate and supply chain at 15%, so it has no concentration in analytics products, and design would arrive inside a build rather than shaping one.
- Starting price
- $25,000+
- Engagement model
- Project and retainer
- Clutch
- 4.9/5, 59 reviews
- Hourly rate
- $25 - $49
- Team size
- 50 - 249 people
- Best for
- the pipeline and platform an analytics product queries.
- Not a fit for
- design-led work on the exploration surface, or budgets under $25,000.
MobiDev
Half of MobiDev's clients are in sports, quietly one of the most analytics-heavy consumer categories: performance figures compared over time by people who argue about them. It has also built an AI damage detection model with a web app around it, which is the harder version of the display problem, since a model's output arrives with a confidence rather than a fact.
Its consumer orientation is the limit: sports at 50%, hospitality and retail at 25% each, with no business software concentration. Sixteen Clutch reviews is a thin record for a 250 to 999 person firm, and its published service percentages are small and scattered rather than showing a design practice.
- Starting price
- $10,000+
- Engagement model
- Project and retainer
- Clutch
- 4.9/5, 16 reviews
- Hourly rate
- $50 - $99
- Team size
- 250 - 999 people
- Best for
- consumer performance data and model output with confidence attached.
- Not a fit for
- B2B analytics products for business users, or budgets under $25,000.
Nimble AppGenie
Nimble AppGenie is 70% mobile app development with financial services at 65% of its clients, and mobile is the neglected half of analytics: an executive checking a figure on a phone needs one number, one comparison and a date range, not a desktop dashboard scaled down. Its record includes a property listing interface with an ownership verification tool.
Nothing in its published work is an analytics or reporting product, and two of its three reviews are marketing websites, one of them with advice on messaging. Fourteen Clutch reviews is a thin record, and no design service line appears in a mix that is otherwise mobile and web development.
- Starting price
- $25,000+
- Engagement model
- Project and retainer
- Clutch
- 5.0/5, 14 reviews
- Hourly rate
- $25 - $49
- Team size
- 50 - 249 people
- Best for
- the mobile view of a metric, built for one glance.
- Not a fit for
- desktop exploration and reporting surfaces, or budgets under $25,000.
Softermii
Softermii built a real-time net worth dashboard for an AI wealth product, and real time is the hardest promise an analytics interface can make: a figure that moves while somebody reads it needs an explicit as-of moment or two people will quote different numbers. Another review served staff, supervisors, directors and parents from one product, which is the same data at four levels.
Its service mix is four AI and mobile lines at 20% each with no design practice named, and medical is 50% of its client base. A $5,000 minimum and a $25 to $49 rate suggest capacity work, so the judgement about what a screen should show would stay in-house.
- Starting price
- $5,000+
- Engagement model
- Project and retainer
- Clutch
- 4.9/5, 48 reviews
- Hourly rate
- $25 - $49
- Team size
- 50 - 249 people
- Best for
- live figures shown to several roles at different levels of detail.
- Not a fit for
- the judgement about what each view should show, or budgets under $25,000.
Innowise
Innowise has the only published data analytics platform on this page: secure pipelines, predictive models and dashboards built for a software company's client. It also lists BI and big data consulting among its services, and financial services and medical are 30% each of its client base, both sectors where a reported number gets audited rather than merely read.
That engagement was delivered as staffing, which is the pattern: 1,000 to 9,999 people supplying capability into somebody else's plan. No design service appears in its mix, and predictive output raises exactly the interface questions, confidence, provenance and recency, that this record does not show anybody answering.
- Starting price
- $10,000+
- Engagement model
- Project and retainer
- Clutch
- 4.9/5, 73 reviews
- Hourly rate
- $50 - $99
- Team size
- 1,000 - 9,999 people
- Best for
- the analytics platform underneath, pipelines and predictive models included.
- Not a fit for
- the interface and trust layer on top, or budgets under $25,000.
How much does an analytics interface design engagement cost?
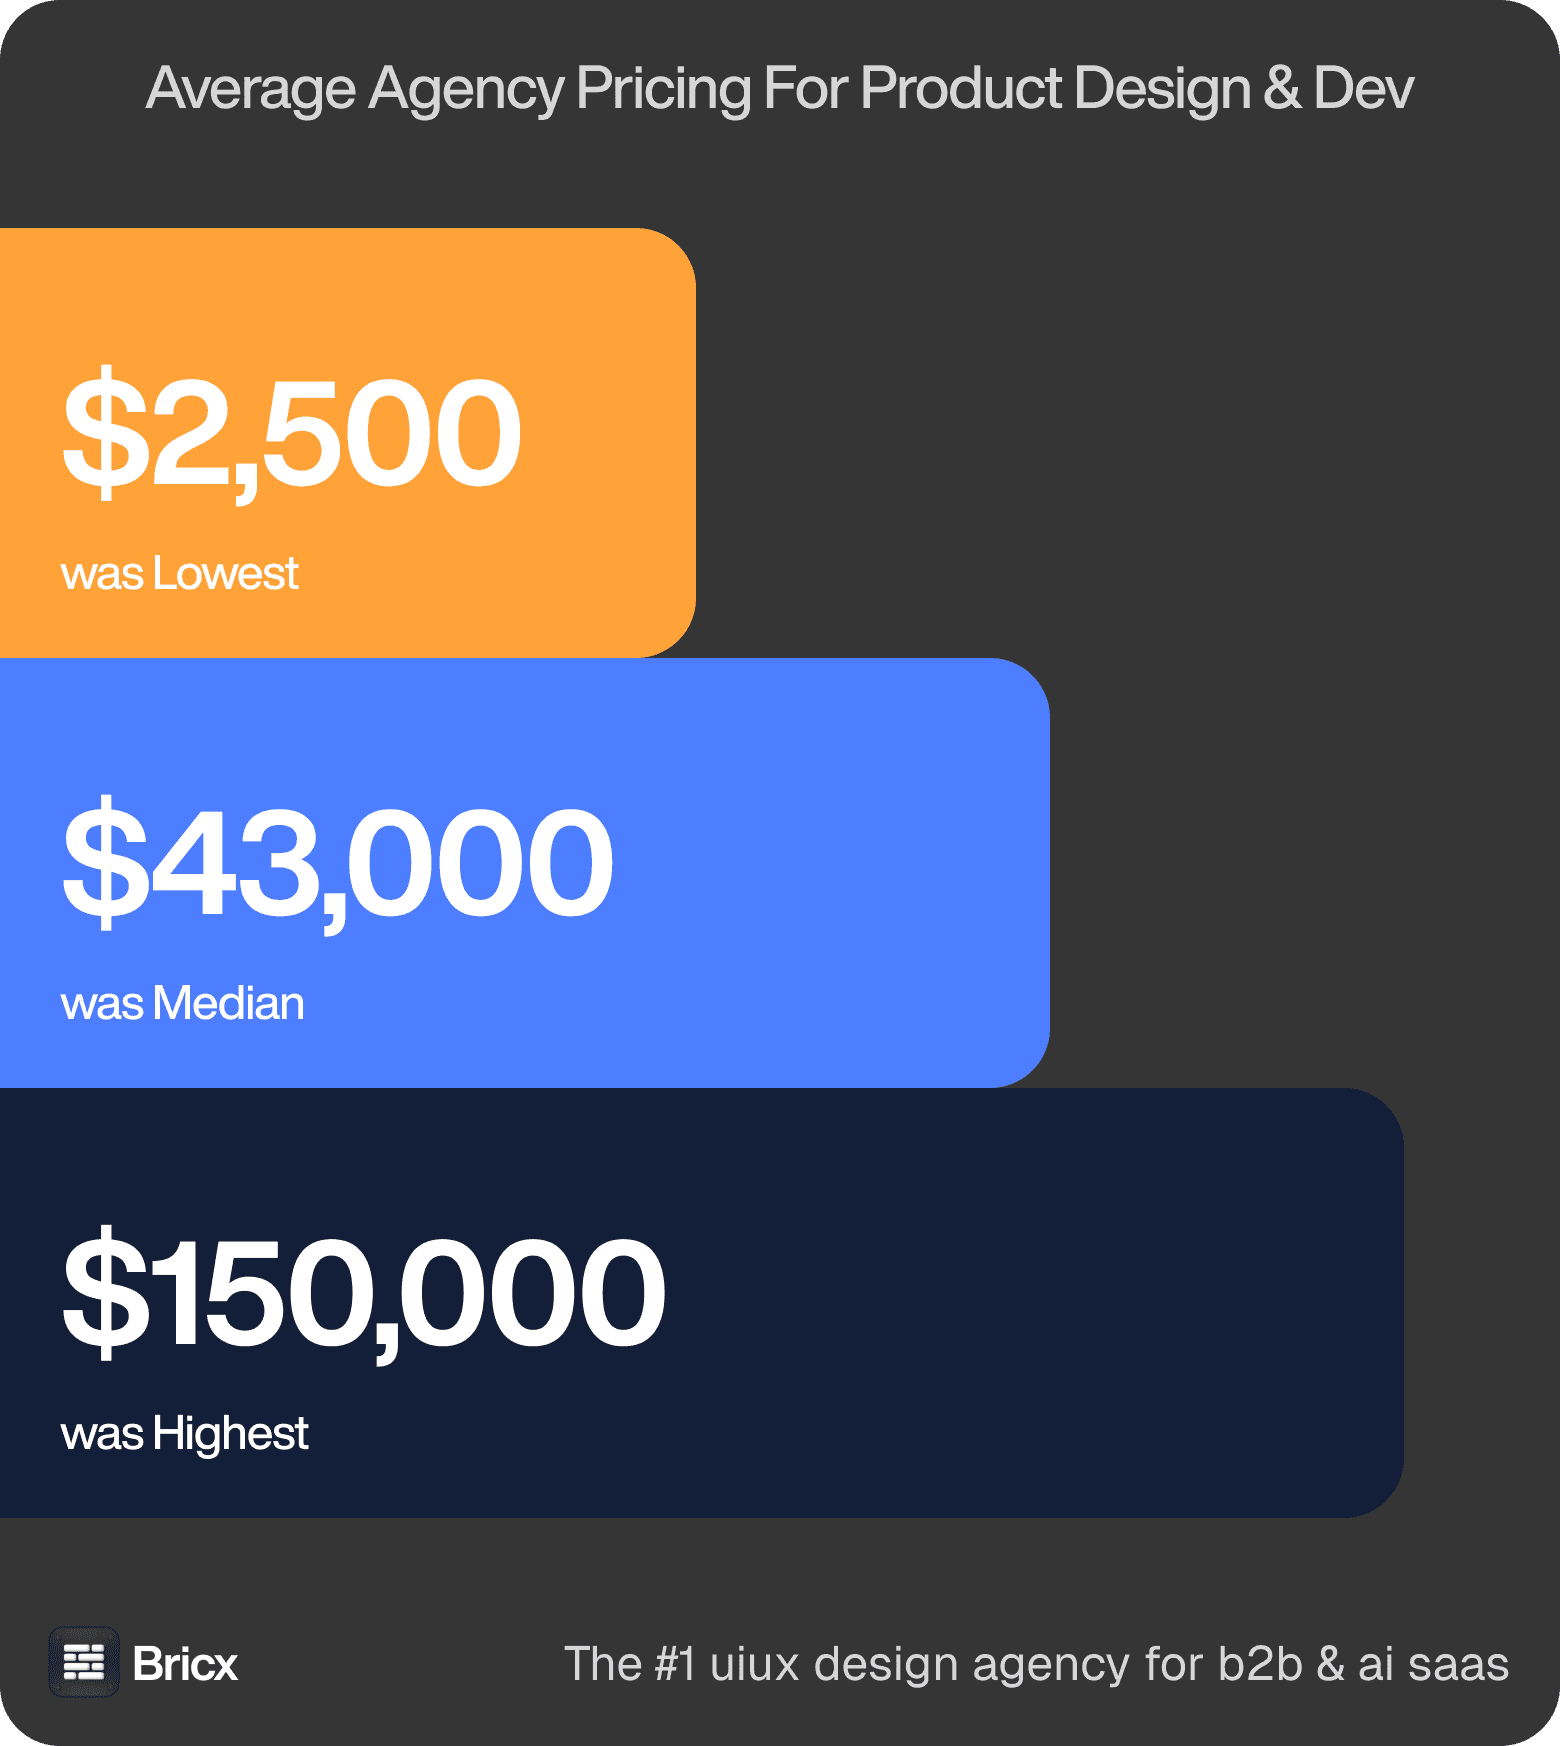
What the same brief actually cost. Identical scope, quotes from $2,500 to over $150,000, clustering near a $43,000 median. Six agencies in ten declined to price it before a further call. Those figures cover product design across the whole benchmark, so treat them as the range an analytics interface is quoted inside rather than a price for it.
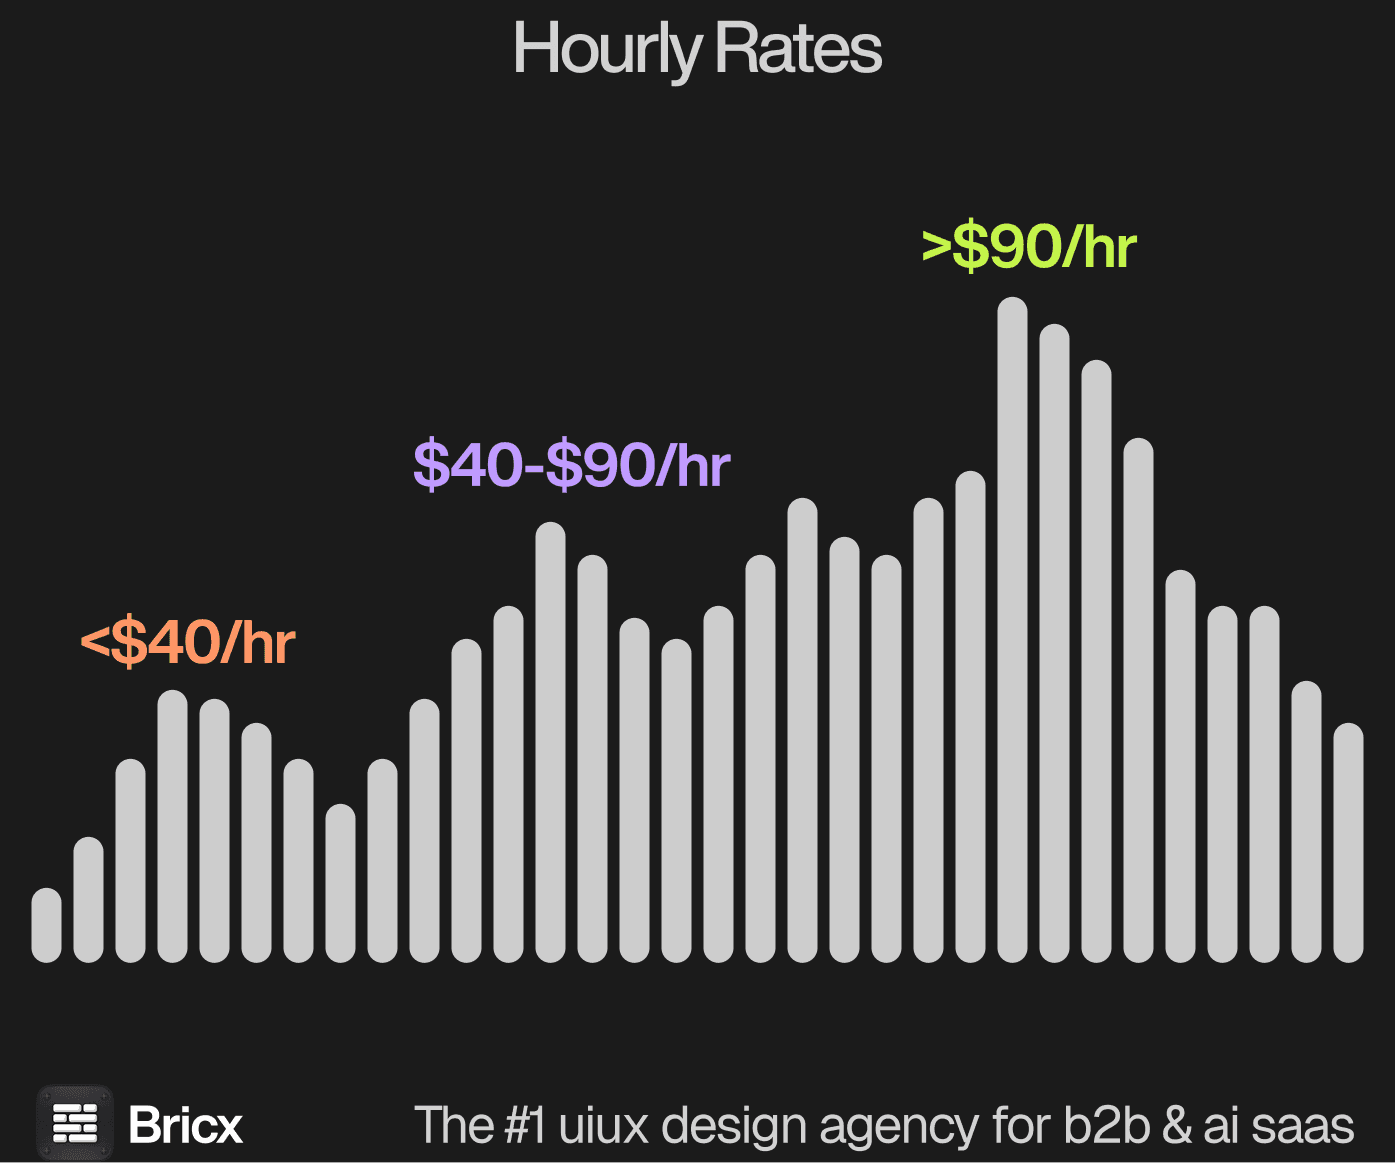
Rates. $25 an hour at the bottom, $195 at the top, most agencies between $55 and $90. Location explains nearly all of it and quality explains almost none. Analytics interfaces run above the median because the screens are few and the states are many: every view needs a loading, partial, empty, stale and disputed version designed.
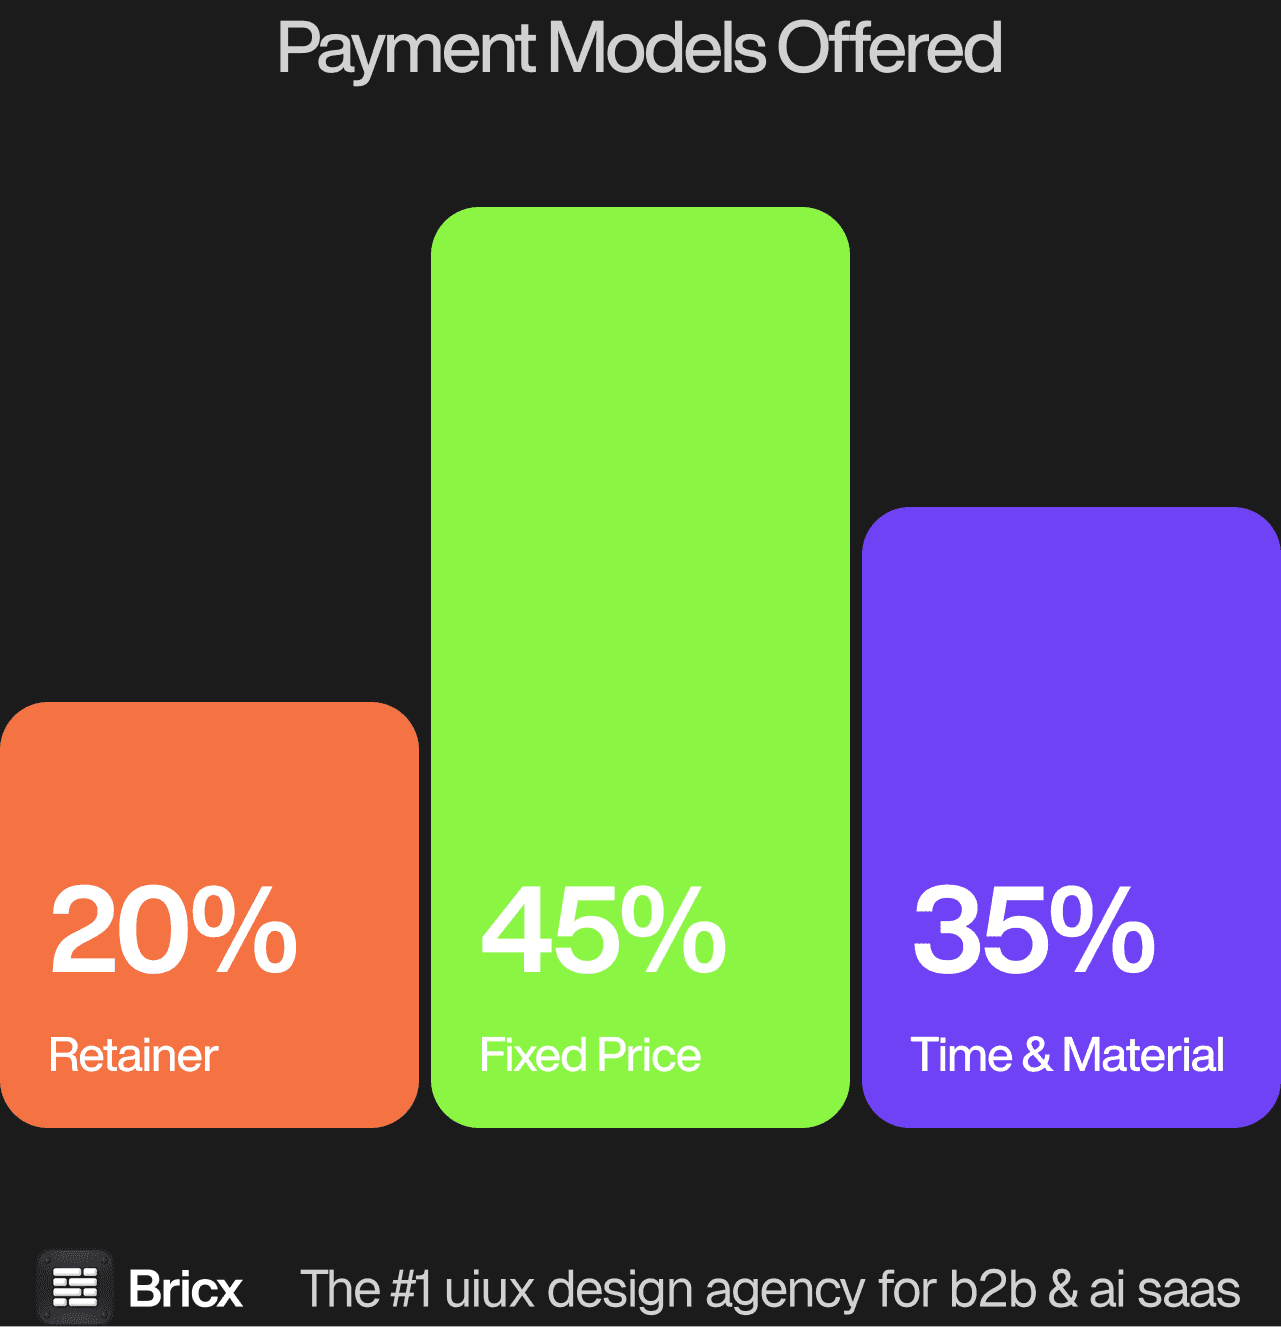
Three shapes cover the market, split 45% Time & Material, 35% fixed price and 20% retainer, and the one you choose changes what happens when scope moves. For an analytics interface the model usually matters more than the headline figure, because it decides what happens when the scope moves.
- Fixed price works for a launch.
- Time & Material works for exploration.
- Retainer works for an ongoing product.
- Which one fits an analytics interface comes down to whether the scope is settled before the work starts.
How do you evaluate an analytics interface design agency?
Five things separate analytics interface design from dashboard design generally.
Ask what happens to a query that takes eight seconds. Waiting is part of this interface. Skeletons, partial results and a way to cancel decide whether somebody keeps exploring or gives up after two questions.
Ask how a number carries its definition. The first challenge in any meeting is why a figure disagrees with another system, and a metric with no visible definition or timestamp loses that argument by default.
Ask how filters and segments compose. Users combine conditions nobody designed for, and the interface has to show what is currently applied clearly enough that a wrong answer looks wrong.
Ask what they do about empty and tiny results. A segment of three people breaks a chart and misleads a reader, and handling small samples honestly is a design decision rather than a data one.
Ask how somebody reaches the rows behind a number. Trust is restored by drilling into the underlying records, and an interface that cannot do that gets exported to a spreadsheet instead.
What are the red flags when hiring a design agency?
- Slides where the work should be. A deck about process is not evidence of shipped design.
- A quote that never moves. Scope changed and price did not means the estimate was padded.
- Junior work in a senior portfolio. Ask who specifically produced the pieces you like.
- No mention of accessibility. For anything customer-facing this is a legal exposure, not a nicety.
- Vague on ownership. Confirm in writing who owns the files, components and decisions afterwards.
- No comparable example of an analytics interface. An agency that cannot point to work of the same shape is learning on your budget.
Should you hire a product design agency or build in-house?
Use an agency while the work has edges: a launch, a rebuild, a first version. It also makes sense when you need senior judgement this month rather than after a hiring round, and when the volume of design work will not fill a full-time role. For an analytics interface specifically, the question worth settling first is how often the work recurs.
Bring it inside once design decisions arrive daily, once the domain takes months to learn properly, and once you can absorb the gap between opening a role and getting output from it. Where an analytics interface falls on that line is usually clear once you count how many times it will need doing again.
Analytics products usually have data people who understand the model and designers who do not, and the gap between them is where the interface goes wrong. Retaining an agency works when the surface is being rethought, because an outsider has to ask what each metric means and the answers turn out to disagree. Hiring makes sense once the shape is settled, since the ongoing work is a hundred small judgements about defaults, precision and labels.
FAQs
What makes an analytics interface hard to design?
Users arrive with questions nobody anticipated, so the surface has to compose rather than answer. Add query latency and the requirement that every number defends its own definition, and most of the work is states rather than screens.
How much does analytics interface design cost?
Fixed-price product design across the benchmark ran $2,500 to over $150,000 with a median near $43,000, and data-dense products sit above that median because each view needs several states designed. Bricx starts at $25,000.
How is this different from dashboard design?
A dashboard answers a question somebody already knew to ask and can be laid out once. An analytics interface is a tool for asking new questions, so filters, comparisons and drill-downs matter far more than the chart choices.
How should slow queries be handled?
Show partial results, keep the interface usable while the query runs and make cancelling obvious. A spinner that blocks the screen for eight seconds trains people to stop exploring, which is the one failure this product cannot afford.