10 Best Data Visualization Design Agencies That Drive Results - July 2026
10 Best Data Visualization Design Agencies That Drive Results - July 2026
10 Best Data Visualization Design Agencies That Drive Results - July 2026
Looking to simplify complex data? Explore the top 10 best data visualization design agencies turning numbers into clear, interactive visuals.
Looking to simplify complex data? Explore the top 10 best data visualization design agencies turning numbers into clear, interactive visuals.
Looking to simplify complex data? Explore the top 10 best data visualization design agencies turning numbers into clear, interactive visuals.
4 minutes
4 minutes
4 minutes
July, 2026
July, 2026
July, 2026

Introduction
Over the last few months, we spoke to over 57 design agencies globally. We ran real sales calls and conducted one of the most comprehensive agency comparisons ever done.
We gave each of them the same project brief and evaluated them across:
Pricing
Engagement Model
Payment Structure
Timeline
Team Structure
Number of Employees
Domain Expertise
Depth of Service
Business Thinking (Conversion Rate Optimization)
Client Collaboration
Dev Handoff Process
Work Setup (Remote or Hybrid)
All this helped us build the "Ultimate UX Agency Benchmarking Report for 2025."
Based on that, we shortlisted the 10 best data visualization design agencies.
While the likes of Bricx, Code and Theory, Fantasy and Stamen were the top contenders based on our data - it's always a good practice to dive deeper and find the ones that match your requirement.
This list will help you choose the one that fits your product goals.

How To Evaluate Your Agency?
Here are the biggest issues we saw across agencies that design dashboards and data-driven interfaces:
Most designs look polished but lack thoughtful interaction models
Agencies often miss storytelling and usability in high-density visualizations
Many do not test edge cases like mobile viewports or real data volume
Needless to say, you need an agency that not only has command over the visual aspects, but can also help you solve these issues in the process. This is where having a comparative list of the top UX agencies can help.
Top 10 Best Data Visualization Design Agencies: [Comparison]
Based on the data gathered from the sales calls, here are the top visualization design agencies:
Agency Name | Employees-to-Client Ratio (Bandwidth) | Process Maturity | AI Design Experience | Client Communication (Meetings + Daily Updates) | App/Web Dev Support | Office Culture |
|---|---|---|---|---|---|---|
Bricx Labs | 1:1 | High | Advanced | Daily async and weekly sync | Partnered dev firms only | Remote-first and async-friendly |
Frog Design | 3:1 | Very High | Intermediate | Bi-weekly updates | Full-stack development | Studio-based, collaborative |
IDEO | 4:1 | Very High | Advanced | Weekly client meetings | Limited | Innovation-focused, in-person |
Pentagram | 2:1 | High | Limited | Structured weekly reviews | Through partners | Design studio, collaborative |
Fjord (Accenture) | 5:1 | Very High | Advanced | Formal weekly reporting | Full integration | Corporate, global presence |
Fantasy | 2:1 | High | Advanced | Daily updates via Slack | Yes, full-stack | Design-focused, hybrid |
Huge | 4:1 | High | Intermediate | Weekly client presentations | Yes, comprehensive | Agency style, collaborative |
R/GA | 3:1 | Very High | Advanced | Regular check-ins | Yes, extensive | Creative agency, global |
Work & Co | 2:1 | High | Intermediate | Twice-weekly updates | Yes, in-house development | Studio environment, collaborative |
Designit | 3:1 | High | Limited | Weekly progress reports | Through partners | Global, design thinking |
Bricx: A Top-Rated Website & UX Design Agency for B2B & AI SaaS
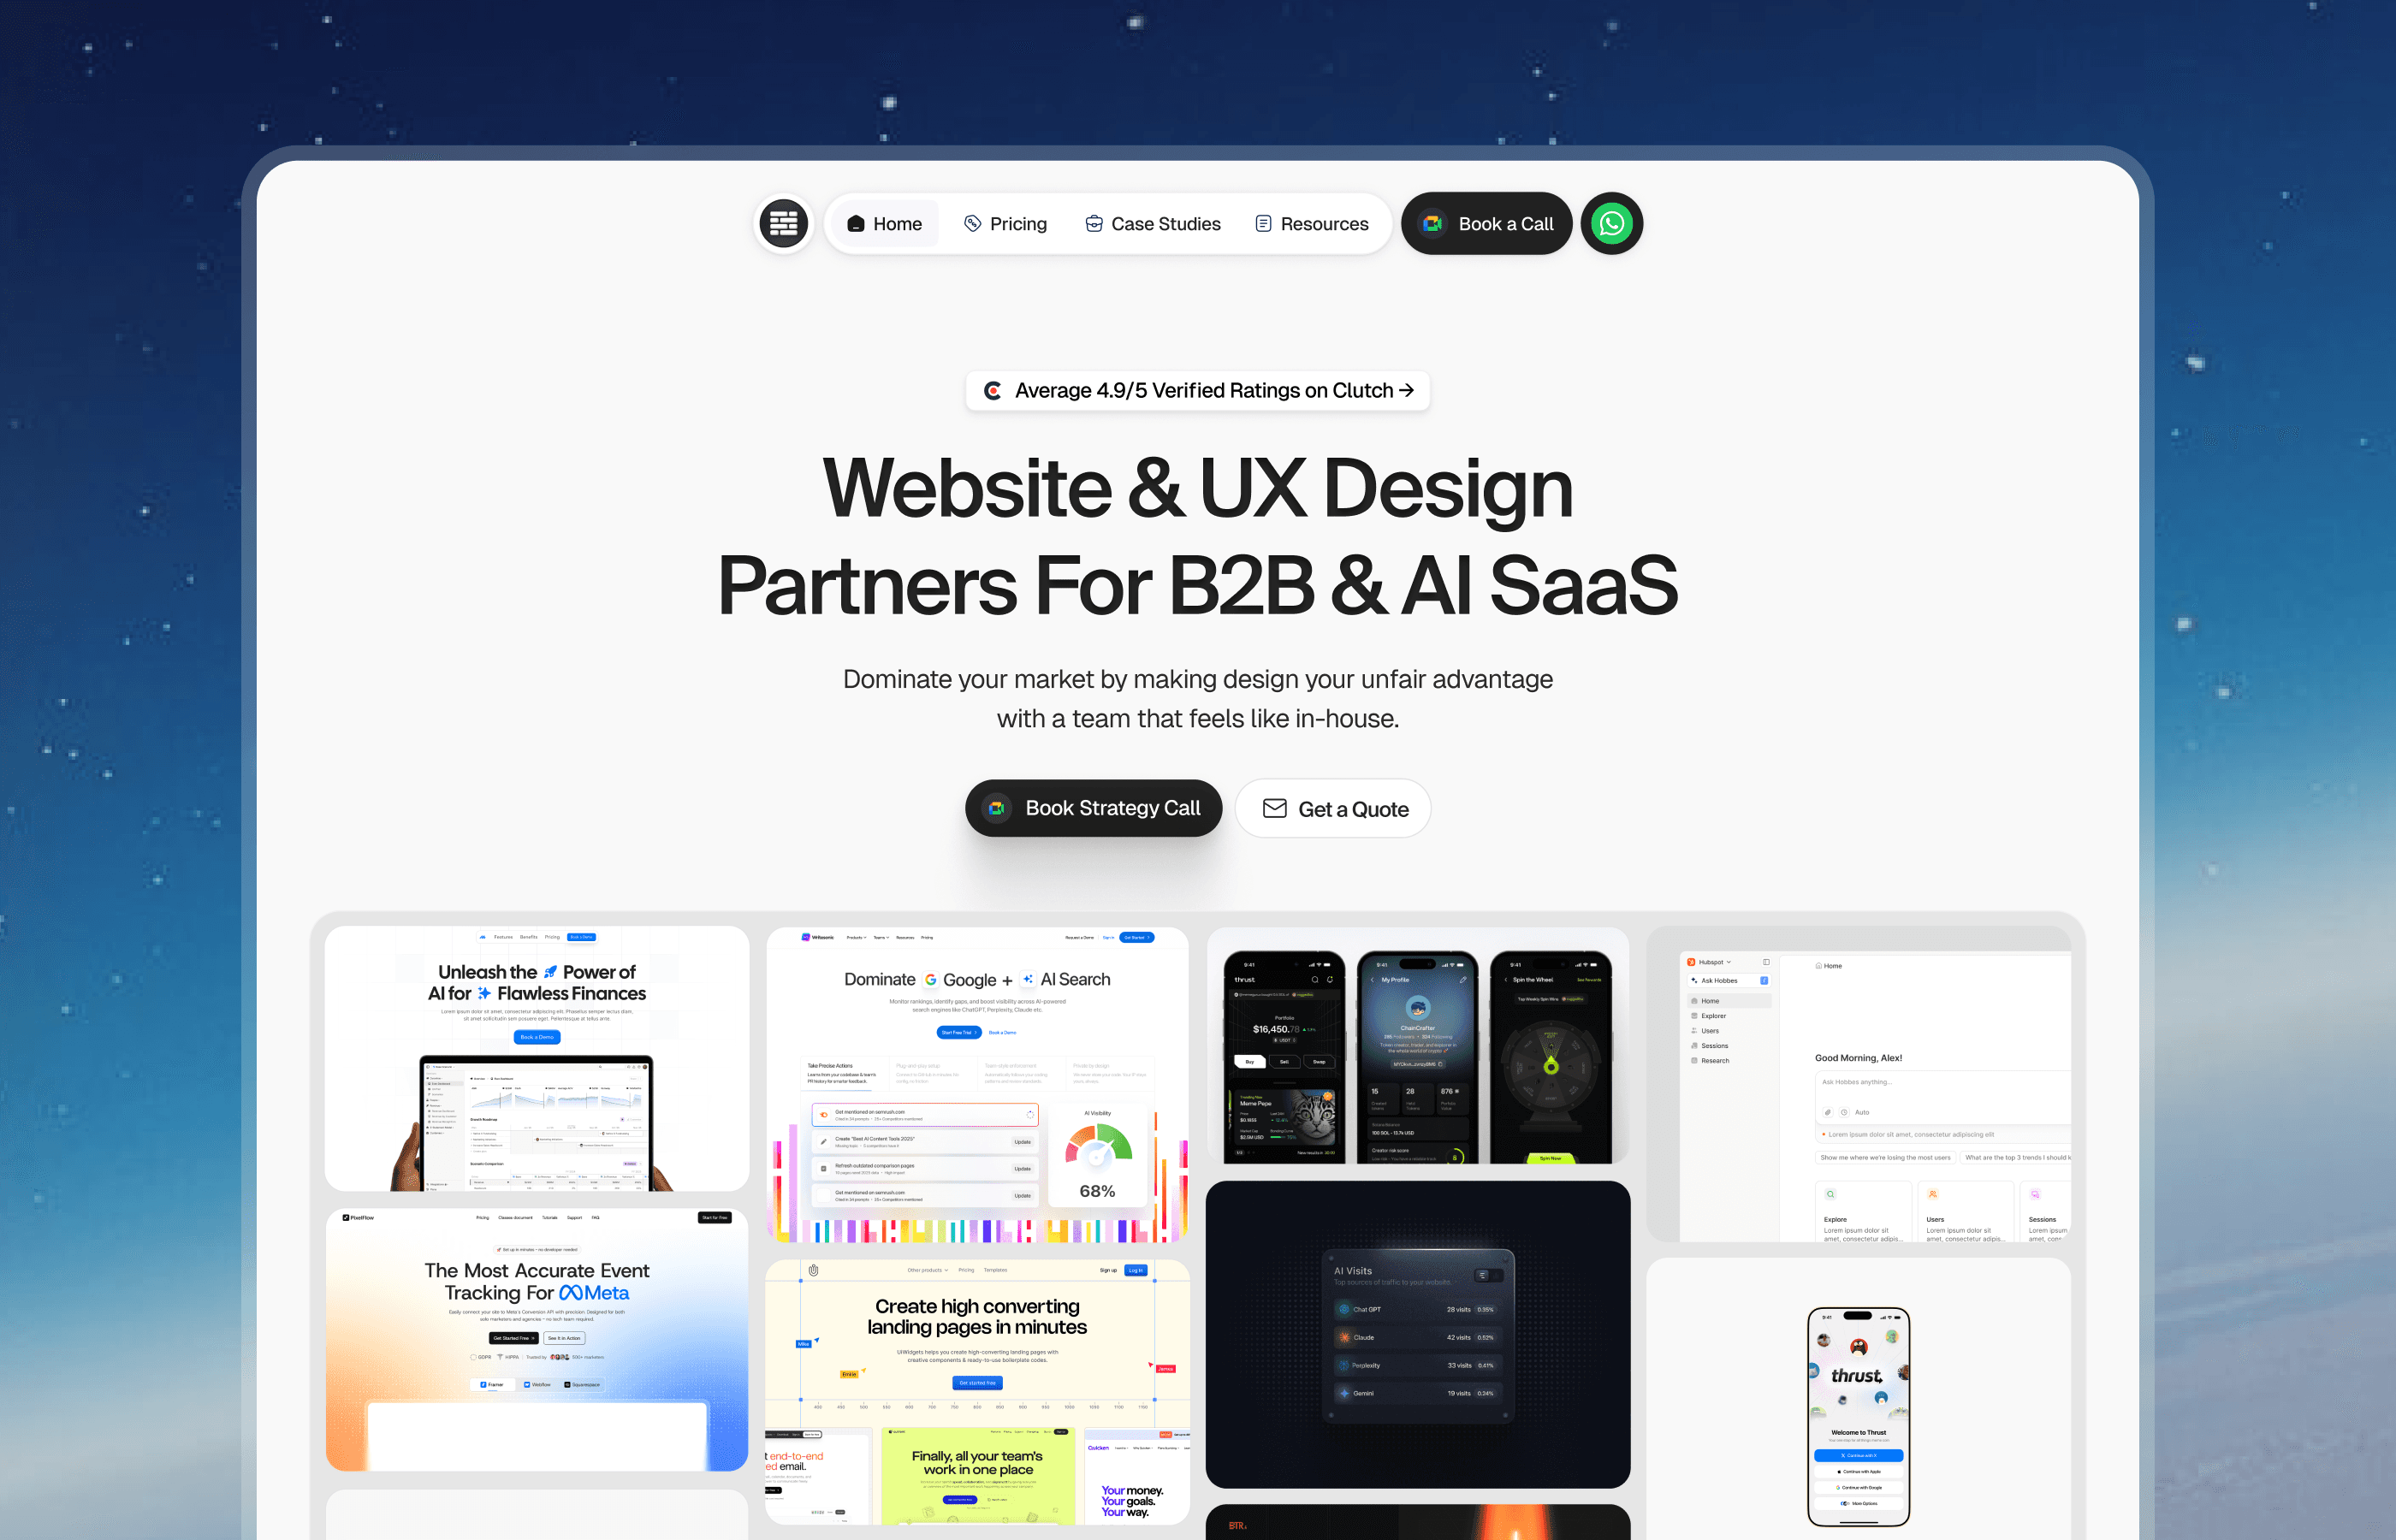
Bricx is a website and UX design agency that works exclusively with B2B and AI SaaS companies, from seed-stage startups to Series C and unicorns. It is known for a rare level of design taste and fast turnaround, across three areas: branding, website design, and product (UX/UI) design. See the portfolio and case studies.
Bricx has completed 50+ SaaS design projects across 30+ industries. Clients include Writesonic (YC S21), Collectwise (YC F24), Gigacatalyst (YC X26), Sybill, Camb.ai, LTV.ai, Instadapp, Hobbes, and AT Kearney. The agency holds 20+ verified five-star reviews on Clutch and publishes 25+ UX case studies.
Two things set Bricx apart: senior-level design taste that makes SaaS products feel genuinely premium, and fast turnaround that keeps pace with venture-backed roadmaps. The work spans the entire funnel, brand, marketing site, and product, with one goal: more signups, higher conversion, and lower user churn.
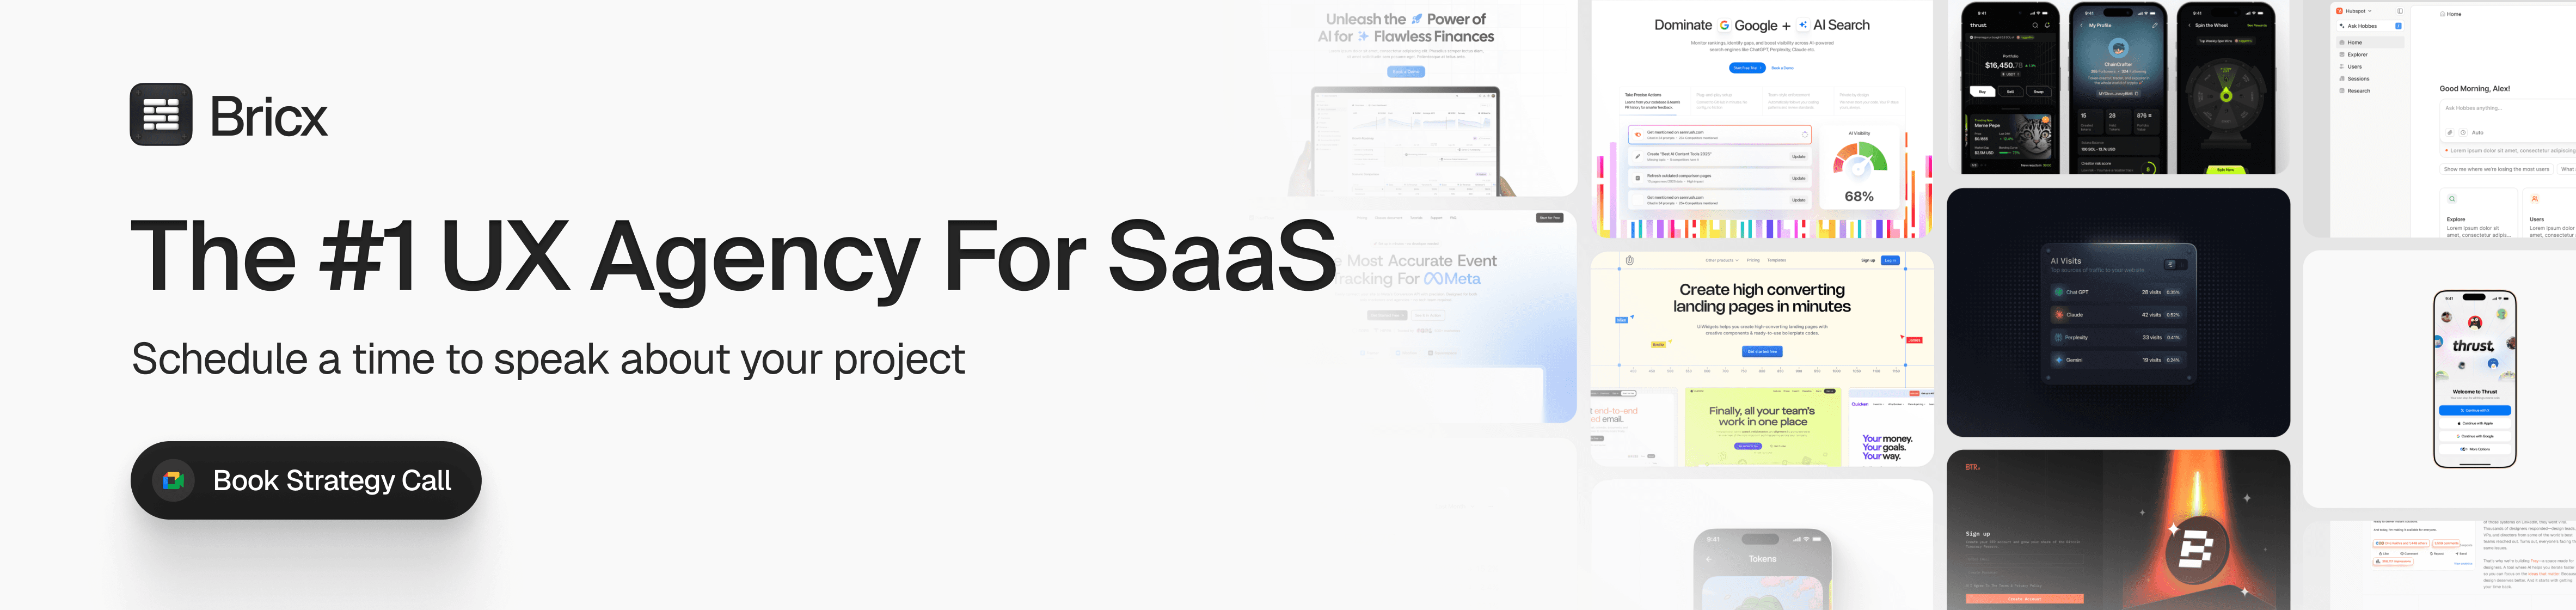
Bricx is a strong fit for B2B and AI SaaS teams that want in-house-level design quality and speed without hiring in-house. Book a strategy call to talk through your product and how Bricx can help.
Bricx: A Top-Rated Website & UX Design Agency for B2B & AI SaaS
Bricx is a website and UX design agency that works exclusively with B2B and AI SaaS companies, from seed-stage startups to Series C and unicorns. It is known for a rare level of design taste and fast turnaround, across three areas: branding, website design, and product (UX/UI) design. See the portfolio and case studies.
Bricx has completed 50+ SaaS design projects across 30+ industries. Clients include Writesonic (YC S21), Collectwise (YC F24), Gigacatalyst (YC X26), Sybill, Camb.ai, LTV.ai, Instadapp, Hobbes, and AT Kearney. The agency holds 20+ verified five-star reviews on Clutch and publishes 25+ UX case studies.
Two things set Bricx apart: senior-level design taste that makes SaaS products feel genuinely premium, and fast turnaround that keeps pace with venture-backed roadmaps. The work spans the entire funnel, brand, marketing site, and product, with one goal: more signups, higher conversion, and lower user churn.
Bricx is a strong fit for B2B and AI SaaS teams that want in-house-level design quality and speed without hiring in-house. Book a strategy call to talk through your product and how Bricx can help.
Code and Theory

Code and Theory has a deep track record in building data-rich experiences for media and tech companies.
As a top data visualization design agency, they focus on dynamic visuals, responsive layouts, and high-traffic resilience. Their team understands how to make real-time data look beautiful and clear.
Employees-to-Client Ratio (Bandwidth): 2:1
Process Maturity: Very High
AI Design Experience: Moderate
Client Communication (Meetings + Daily Updates): Structured and PM-led
App/Web Dev Support: In-house development team
Office Culture: Cross-functional and hybrid
Fantasy

Fantasy crafts future-facing digital experiences and excels at creating data interfaces for enterprise and fintech products.
They are known as one of the best data visualization design agencies for their clean typography, smart hover states, and bold visual systems that make KPIs easy to read.
Employees-to-Client Ratio (Bandwidth): 2:1
Process Maturity: Very High
AI Design Experience: High
Client Communication (Meetings + Daily Updates): Bi-weekly strategy reviews
App/Web Dev Support: Yes
Office Culture: Design-first and global
Stamen

Stamen is a boutique agency specializing in data visualization, especially maps and interactive graphics. Their team is highly skilled in visual storytelling and scientific data display.
They have worked with major institutions to make complicated datasets understandable and visually impressive.
Employees-to-Client Ratio (Bandwidth): 1.5:1
Process Maturity: Moderate
AI Design Experience: Low
Client Communication (Meetings + Daily Updates): Weekly standups
App/Web Dev Support: Yes
Office Culture: Research-oriented
Pitch Interactive

Pitch Interactive combines design, data science, and art to build stunning data visualizations.
They are known for their creative use of interaction and motion, helping organizations tell impactful data stories. Their work is often displayed in galleries and media platforms.
Employees-to-Client Ratio (Bandwidth): 1.5:1
Process Maturity: Moderate
AI Design Experience: Low
Client Communication (Meetings + Daily Updates): Creative syncs weekly
App/Web Dev Support: In-house
Office Culture: Experimental and independent
Beyond
Beyond builds digital products that make data work better for users. As one of the best data visualization design agencies, they bring strategy, design, and engineering together. Their work includes dashboards, reports, and real-time analytics for SaaS and fintech.
Employees-to-Client Ratio (Bandwidth): 1.5:1
Process Maturity: High
AI Design Experience: Moderate
Client Communication (Meetings + Daily Updates): Weekly sprint reviews
App/Web Dev Support: Yes
Office Culture: Lean and agile
FFunction
FFunction focuses entirely on visualizing data for impact. From nonprofits to publishers, they specialize in turning statistics into interactive experiences. They design for both desktop and mobile, ensuring every insight is accessible and clear.
Employees-to-Client Ratio (Bandwidth): 1:1
Process Maturity: Moderate
AI Design Experience: Low
Client Communication (Meetings + Daily Updates): Weekly feedback sessions
App/Web Dev Support: Yes
Office Culture: Mission-driven
ClearPoint

ClearPoint partners with government and enterprise clients to create performance dashboards. They’re one of the best data visualization design agencies for structured UIs, high information density, and decision-focused layouts that executives rely on.
Employees-to-Client Ratio (Bandwidth): 2:1
Process Maturity: High
AI Design Experience: Low
Client Communication (Meetings + Daily Updates): Monthly alignment reviews
App/Web Dev Support: Yes
Office Culture: Formal and results-oriented
Code and Theory
Code and Theory has a deep track record in building data-rich experiences for media and tech companies.
As a top data visualization design agency, they focus on dynamic visuals, responsive layouts, and high-traffic resilience. Their team understands how to make real-time data look beautiful and clear.
Employees-to-Client Ratio (Bandwidth): 2:1
Process Maturity: Very High
AI Design Experience: Moderate
Client Communication (Meetings + Daily Updates): Structured and PM-led
App/Web Dev Support: In-house development team
Office Culture: Cross-functional and hybrid
Fantasy
Fantasy crafts future-facing digital experiences and excels at creating data interfaces for enterprise and fintech products.
They are known as one of the best data visualization design agencies for their clean typography, smart hover states, and bold visual systems that make KPIs easy to read.
Employees-to-Client Ratio (Bandwidth): 2:1
Process Maturity: Very High
AI Design Experience: High
Client Communication (Meetings + Daily Updates): Bi-weekly strategy reviews
App/Web Dev Support: Yes
Office Culture: Design-first and global
Stamen
Stamen is a boutique agency specializing in data visualization, especially maps and interactive graphics. Their team is highly skilled in visual storytelling and scientific data display.
They have worked with major institutions to make complicated datasets understandable and visually impressive.
Employees-to-Client Ratio (Bandwidth): 1.5:1
Process Maturity: Moderate
AI Design Experience: Low
Client Communication (Meetings + Daily Updates): Weekly standups
App/Web Dev Support: Yes
Office Culture: Research-oriented
Pitch Interactive
Pitch Interactive combines design, data science, and art to build stunning data visualizations.
They are known for their creative use of interaction and motion, helping organizations tell impactful data stories. Their work is often displayed in galleries and media platforms.
Employees-to-Client Ratio (Bandwidth): 1.5:1
Process Maturity: Moderate
AI Design Experience: Low
Client Communication (Meetings + Daily Updates): Creative syncs weekly
App/Web Dev Support: In-house
Office Culture: Experimental and independent
Beyond
Beyond builds digital products that make data work better for users. As one of the best data visualization design agencies, they bring strategy, design, and engineering together. Their work includes dashboards, reports, and real-time analytics for SaaS and fintech.
Employees-to-Client Ratio (Bandwidth): 1.5:1
Process Maturity: High
AI Design Experience: Moderate
Client Communication (Meetings + Daily Updates): Weekly sprint reviews
App/Web Dev Support: Yes
Office Culture: Lean and agile
FFunction
FFunction focuses entirely on visualizing data for impact. From nonprofits to publishers, they specialize in turning statistics into interactive experiences. They design for both desktop and mobile, ensuring every insight is accessible and clear.
Employees-to-Client Ratio (Bandwidth): 1:1
Process Maturity: Moderate
AI Design Experience: Low
Client Communication (Meetings + Daily Updates): Weekly feedback sessions
App/Web Dev Support: Yes
Office Culture: Mission-driven
ClearPoint
ClearPoint partners with government and enterprise clients to create performance dashboards. They’re one of the best data visualization design agencies for structured UIs, high information density, and decision-focused layouts that executives rely on.
Employees-to-Client Ratio (Bandwidth): 2:1
Process Maturity: High
AI Design Experience: Low
Client Communication (Meetings + Daily Updates): Monthly alignment reviews
App/Web Dev Support: Yes
Office Culture: Formal and results-oriented

DesignMap
DesignMap works with enterprise SaaS and healthcare platforms to solve deep UX problems. They’re ideal for turning operational data into easy-to-use interfaces and improving the scannability of list and table views.
Employees-to-Client Ratio (Bandwidth): 1.5:1
Process Maturity: Very High
AI Design Experience: Moderate
Client Communication (Meetings + Daily Updates): Strategic syncs weekly
App/Web Dev Support: Yes
Office Culture: Quiet and analytical
Upstatement

Upstatement blends storytelling, UX, and frontend craft. Their projects often feature beautiful and interactive visualizations for data-heavy editorial or nonprofit use cases. Their strength lies in balancing creativity with technical performance.
Employees-to-Client Ratio (Bandwidth): 1.5:1
Process Maturity: High
AI Design Experience: Moderate
Client Communication (Meetings + Daily Updates): Weekly content check-ins
App/Web Dev Support: In-house frontend
Office Culture: Creative studio
Conclusion
The best data visualization design agencies don’t just make pretty charts. They help teams make faster decisions, uncover insights, and tell better stories through UX.
At Bricx, we specialize in making dashboards that users love and executives trust.
DesignMap
DesignMap works with enterprise SaaS and healthcare platforms to solve deep UX problems. They’re ideal for turning operational data into easy-to-use interfaces and improving the scannability of list and table views.
Employees-to-Client Ratio (Bandwidth): 1.5:1
Process Maturity: Very High
AI Design Experience: Moderate
Client Communication (Meetings + Daily Updates): Strategic syncs weekly
App/Web Dev Support: Yes
Office Culture: Quiet and analytical
Upstatement
Upstatement blends storytelling, UX, and frontend craft. Their projects often feature beautiful and interactive visualizations for data-heavy editorial or nonprofit use cases. Their strength lies in balancing creativity with technical performance.
Employees-to-Client Ratio (Bandwidth): 1.5:1
Process Maturity: High
AI Design Experience: Moderate
Client Communication (Meetings + Daily Updates): Weekly content check-ins
App/Web Dev Support: In-house frontend
Office Culture: Creative studio
Conclusion
The best data visualization design agencies don’t just make pretty charts. They help teams make faster decisions, uncover insights, and tell better stories through UX.
At Bricx, we specialize in making dashboards that users love and executives trust.
Author:


Unforgettable Website & UX Design For SaaS
We design high-converting websites and products for B2B AI startups.


Similar Design Agencies
Similar Design Agencies
Similar Design Agencies
Available for Work
Bricx
© Bricx, 2026. All rights reserved.


Available for Work
Bricx
© Bricx, 2026. All rights reserved.
Available for Work
Bricx
© Bricx, 2026. All rights reserved.
Available for Work
Bricx
© Bricx, 2026. All rights reserved.
