Website Design
Website Design
Website Design
Insights
Insights
Insights
December 8, 2025
December 8, 2025
December 8, 2025
What Is Tree Testing in UX?: A Complete Guide
What Is Tree Testing in UX?: A Complete Guide
What Is Tree Testing in UX?: A Complete Guide
Discover what is tree testing in ux and how it clarifies navigation, helping SaaS teams build intuitive product structures before coding.
Discover what is tree testing in ux and how it clarifies navigation, helping SaaS teams build intuitive product structures before coding.
Discover what is tree testing in ux and how it clarifies navigation, helping SaaS teams build intuitive product structures before coding.
4 mins
4 mins
4 mins


So, you’ve spent weeks mapping out the navigation for your new B2B SaaS platform. In your head, the structure is perfect—a flawless, logical flow that guides users exactly where they need to go. But here's the tough question: will your users see it that way?
This is where tree testing comes in. Think of it as a way to check the blueprint of your house before you start building. You wouldn't want to find out the only path to the kitchen is through a bedroom after the walls are up, right?
Untangling Your Navigation: What Is Tree Testing in UX?

Tree testing is a UX research method that zeroes in on one thing: the findability of information within your product's structure. It completely ignores the visual design—no colors, no icons, no fancy layouts. It's all about the logic of your information hierarchy.
Imagine handing someone a text-only outline of your website's navigation menu. Then, you give them a simple task, like, "Find where you would update your payment method." You get to watch as they click through the text labels, revealing whether your structure makes sense to a real user. It’s a pure test of your site’s skeleton.
Does "Billing History" belong under "Account Settings" or "Company Profile"? Instead of guessing, tree testing gives you clear, data-backed answers.
Why It's a Game-Changer for SaaS Products
For complex B2B and AI tools, intuitive navigation is everything. If users can't find a feature, it might as well not exist. Tree testing helps you answer mission-critical questions long before a single line of code is written:
Are our labels clear? Do terms like "Integrations," "Workflows," and "Analytics" mean the same thing to our users as they do to us?
Is our content grouped logically? Did we put things where users naturally expect to find them?
Can people find what they need? How quickly and directly can a user complete a key task?
By stripping away the UI, you get raw, unbiased feedback on the underlying logic of your product's navigation. This is the bedrock of strong information architecture in UX.
A Lean, Mean, Insight-Generating Machine
Tree testing isn't new, but it has become a go-to method for a reason. It's fast, effective, and provides hard numbers to guide your decisions. Most tests take just 10 to 15 minutes for a user to complete, making it incredibly easy to find participants and get results quickly.
To put it simply, here are the core components of tree testing.
Tree Testing At a Glance
Aspect | Description |
|---|---|
Primary Goal | To evaluate the findability and logic of an information hierarchy, separate from visual design. |
When to Use It | Early in the design process, before wireframing or visual design begins, or when redesigning existing navigation. |
Key Questions Answered | Are our labels intuitive? Is content grouped correctly? Can users find what they're looking for without getting lost? |
This table shows just how focused this technique is—it's all about validating the "where" before you get bogged down in designing the "how."
In essence, tree testing is like giving someone a map without landmarks. If they can still reach their destination, you know your map's core structure is sound.
This approach ends those endless team debates over navigation. No more relying on opinions or "I think it should go here." You can walk into a meeting with data that shows 75% of users couldn't find the reporting feature because it was buried under a vague "Resources" label. That’s a conversation-ender.
By focusing on structure first, you're embracing the core of what makes navigation work. It also ties directly into broader interactive navigation principles, ensuring the foundation of your user experience is solid from the very start.
When to Use Tree Testing in Your Design Process
In product design, timing is everything. Launching the right test at the right moment can save you from shipping a confusing product and prevent a world of expensive rework down the line. Tree testing has a definite sweet spot in the design process where it delivers the most bang for your buck.
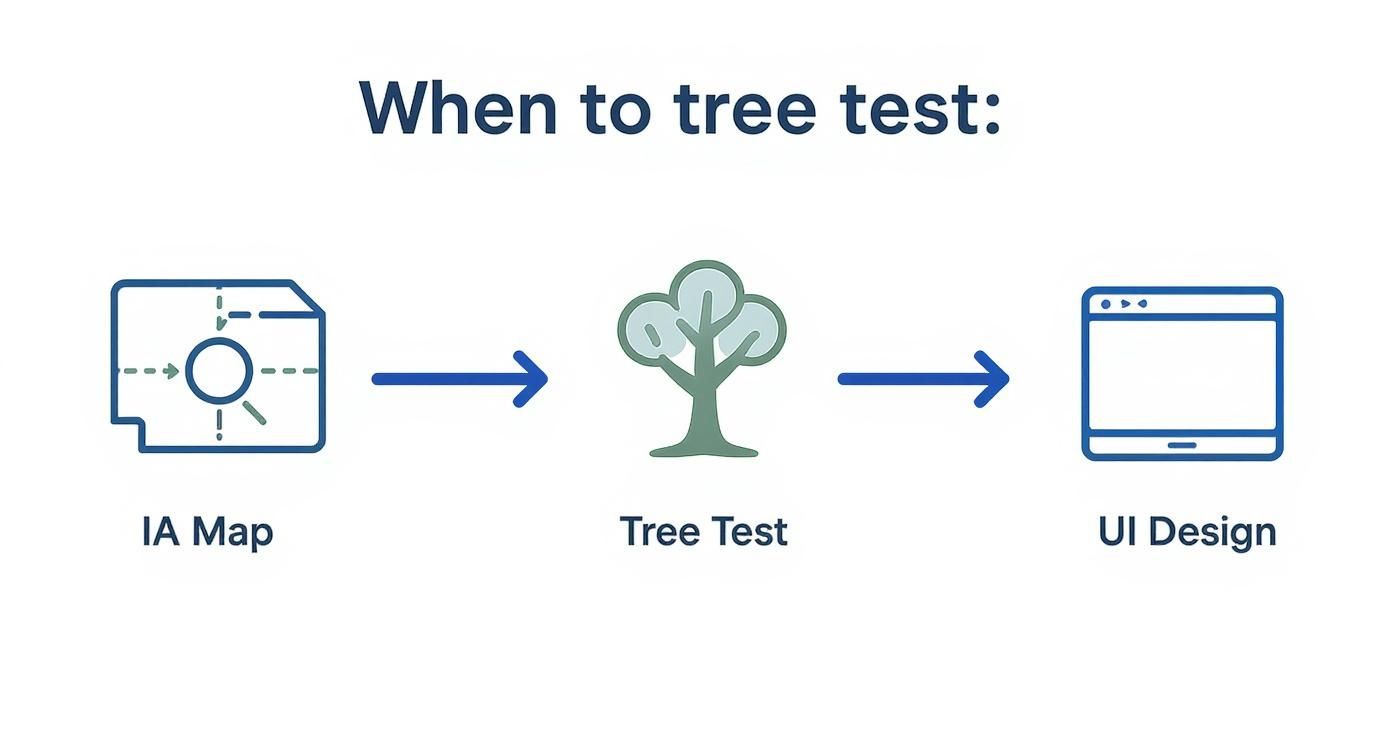
The perfect time to run a tree test is after you've mapped out a proposed information architecture (IA) but before a single wireframe or visual design has been created. This is that critical window where you have a logical structure—maybe one you built from a card sorting exercise—but haven't yet sunk time and resources into building an interface around it.
Think of it like this: card sorting helps you figure out how your users group ideas together. Tree testing then comes in to validate if the navigation structure you built based on those groupings actually works when people try to find things.
Key Moments for SaaS Teams to Tree Test
For anyone building B2B or AI SaaS products, you know how quickly complexity can spiral out of control and overwhelm users. Tree testing isn't just a nice-to-have; it's a strategic necessity for making sure your product’s foundation is solid. Here are a few high-impact scenarios where it really proves its worth.
Validating a Redesigned Navigation
Planning a major overhaul of your main navigation or settings menu? Before you commit, a tree test can confirm whether your new structure is a genuine improvement. You can even test your current IA first to get a baseline score, giving you hard data on which pain points the redesign needs to fix.Integrating a New Feature Set
When you roll out a new batch of features, the biggest risk is that nobody can find them. Where should that new "AI-powered reporting" module live? Does it belong under "Analytics"? Or maybe it needs a new top-level spot called "Insights"? A tree test takes the guesswork out of it, giving you clear data on where users naturally expect it to be.Comparing Different IA Concepts
Sometimes, there are two or more perfectly logical ways to organize your content. Instead of getting stuck in endless debates fueled by team opinions, you can build two different "trees" and run an A/B tree test. Let real user performance data tell you which structure is the winner.
Tree testing transforms subjective arguments about labels and hierarchies into objective, data-driven decisions. It’s the proof you bring to a stakeholder meeting to say, "We tested this—80% of users found the feature here, while only 30% found it over there."
Using Data to Defend Design Choices
One of the best things about tree testing is the clear, quantitative evidence it produces. When a stakeholder asks why a feature is buried three levels deep in a particular menu, you can move past "it just felt right" and confidently say, "our research shows this is the most findable spot." This builds incredible trust in the design process and keeps decisions focused on the user.
This kind of validation is also crucial for bigger company goals. For SaaS companies in a growth spurt, adopting digital transformation best practices is key, and a user-centric approach is non-negotiable. By proving your product's core structure works, you lay a stable foundation for future features, drive adoption, and ultimately improve retention.
To see how tree testing fits into the bigger picture of validation, you can explore other UX research techniques that help create truly user-friendly products.
How to Run a Successful Tree Test?
Jumping into your first tree test is a lot less intimidating than it sounds. If you break the process down into a few clear, manageable stages, you can go from a rough navigation structure to solid, actionable insights pretty quickly.
Let's walk through how to set up and launch a study for your own SaaS product.
The whole point is to create a focused experiment that isolates your information architecture (IA). This way, the feedback you get is purely about your structure and labels—not clouded by visual design or UI elements.
Step 1: Prepare Your "Tree"
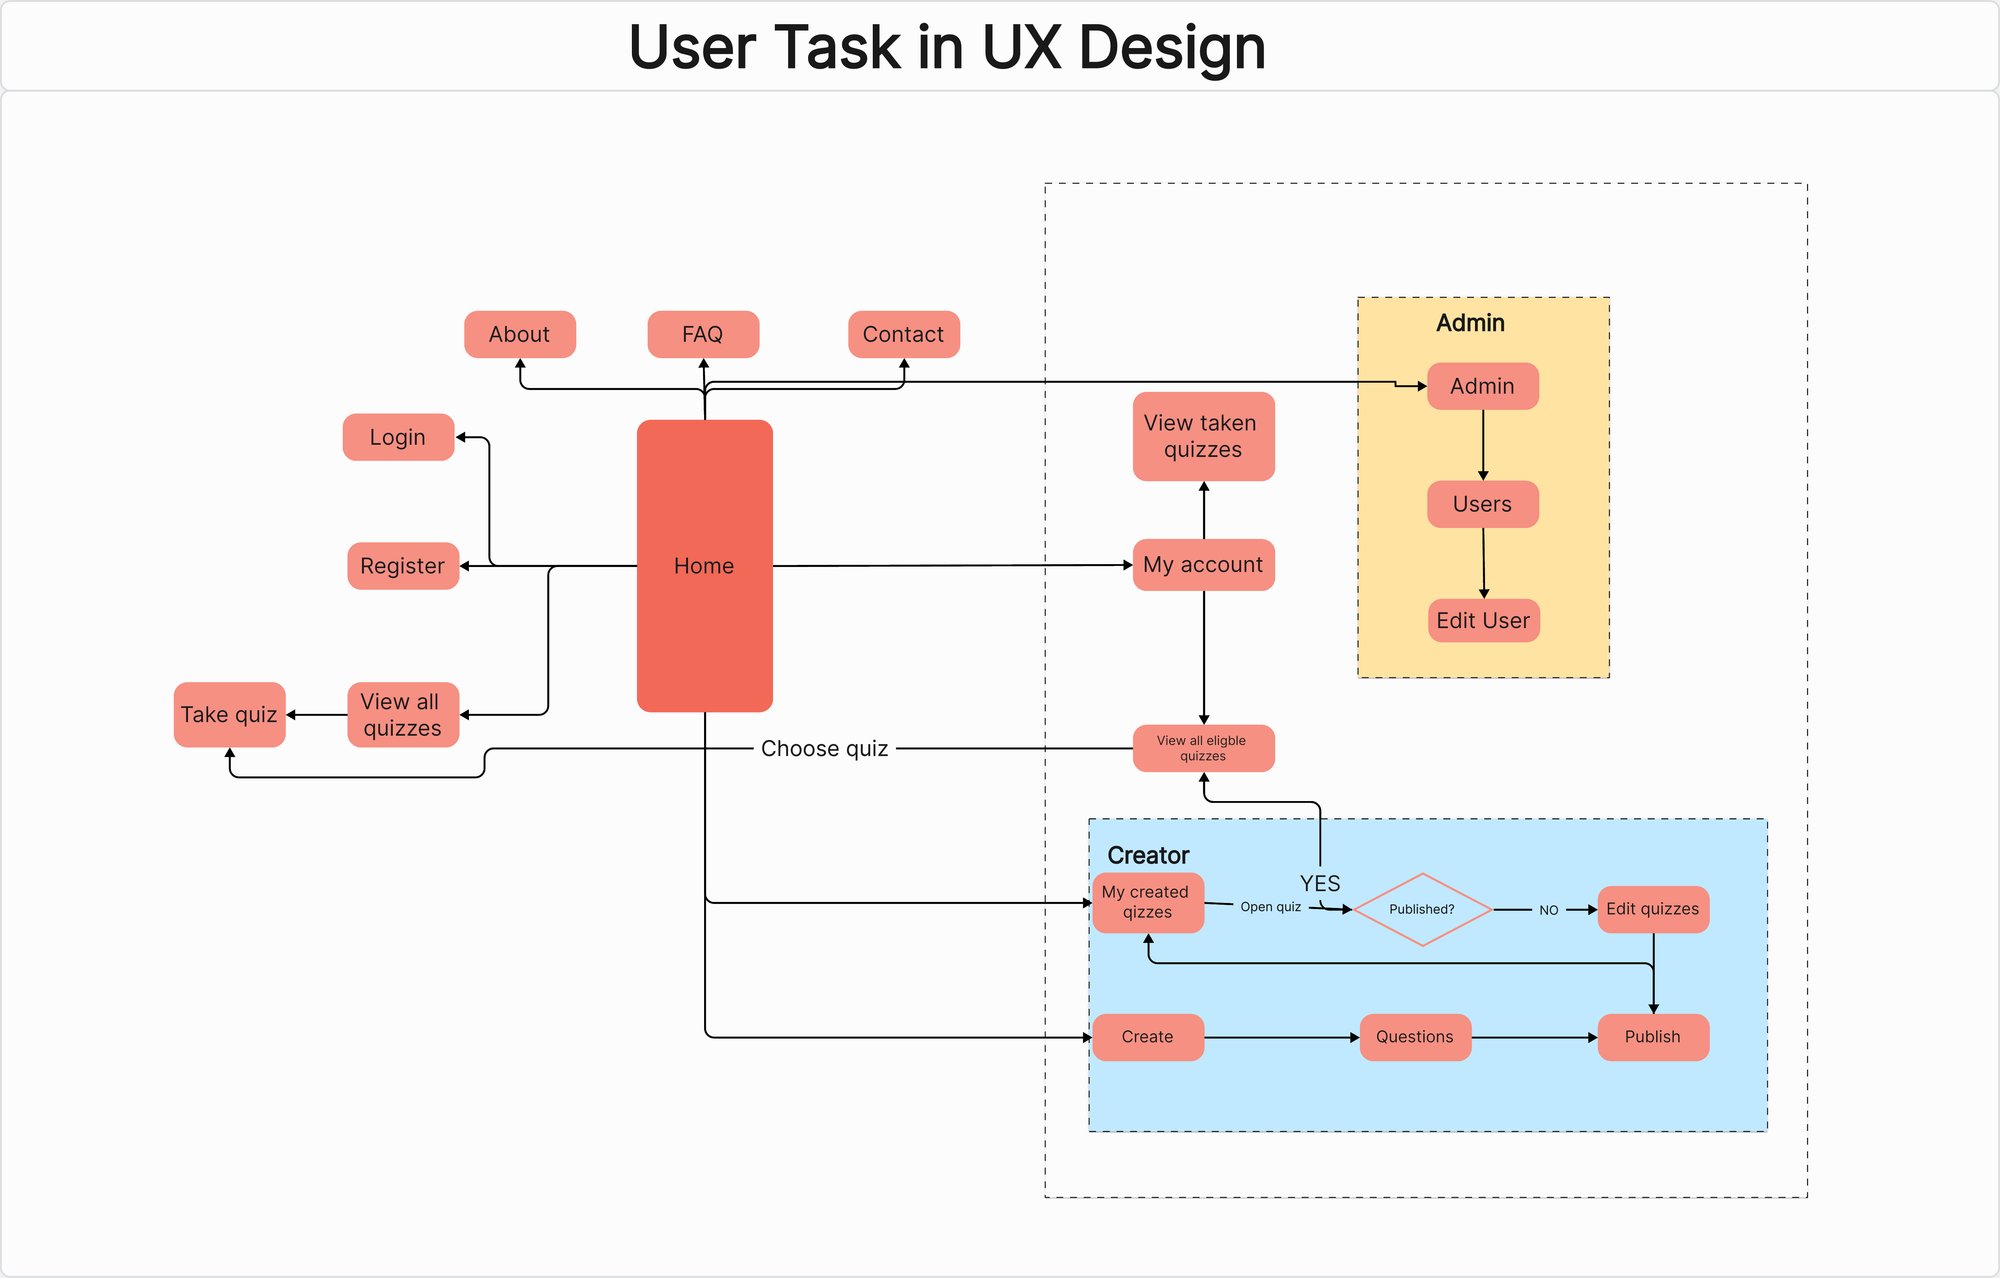
First things first, you need to build your "tree." This is just a text-only, hierarchical version of your product's navigation—think of it as the bare-bones skeleton of your sitemap. You don't need fancy design tools for this; a simple spreadsheet or even a bulleted list in a text doc will do the trick.
Start by listing all your top-level navigation items. Then, underneath each one, just indent to show the sub-categories. Keep doing this until you've mapped out every single level of the navigation you want to test.
It's absolutely crucial that the tree you build is an exact match of the IA you're proposing. Any little difference between your test tree and the real structure can skew your results and send you down the wrong path.
The end goal is a clean, text-based hierarchy that people can click through. Most modern testing platforms let you copy and paste this structure right into their tool.
Step 2: Craft Realistic User Tasks
Once your tree is ready, it's time to write the tasks your participants will try to complete. Honestly, this is probably the most critical part of the whole setup. The quality of your tasks directly determines the quality of your data. A great task puts the user in a realistic scenario where they have a specific goal in mind.
A common mistake is using the same words in your task that you use in your navigation labels. For instance, if you have a label called "Subscription Management," a bad task would be "Find where to manage your subscription." That’s not a test of findability; it's just a word-matching game.
Instead, think from the user's point of view:
Weak Task: "Click on Billing Information."
Strong Task: "You just got an email that your monthly invoice is ready. Where would you go to view and download it?"
See the difference? The second one forces people to actually think about their goal and interpret your navigation to find the right path—which is exactly what they do in the real world. Try to stick to a maximum of 10 tasks to keep the test focused and prevent your participants from getting tired or bored.
Step 3: Recruit the Right Participants
Your results are only as good as the people you test with. It's so important to recruit participants who truly represent your target user personas. If you're designing an AI analytics platform for data scientists, getting feedback from marketing managers won't give you the insights you need.
The best way to do this is with a short screener survey. Ask a few questions about their job role, industry, and maybe how familiar they are with similar tools. This little step ensures the people taking your test have the same context and expectations as your actual users.
For your results to be statistically sound, you should aim for at least 30-50 participants for each study. Many testing platforms offer recruitment services, which makes finding qualified people who fit your demographic profile a breeze. If you're looking for the right platform, check out some of the best user testing tools on the market.
Step 4: Launch and Analyze Your Study
Alright, your tree is built, your tasks are written, and your participants are lined up. You're ready to launch! Using a specialized tool for this makes the entire process incredibly smooth.
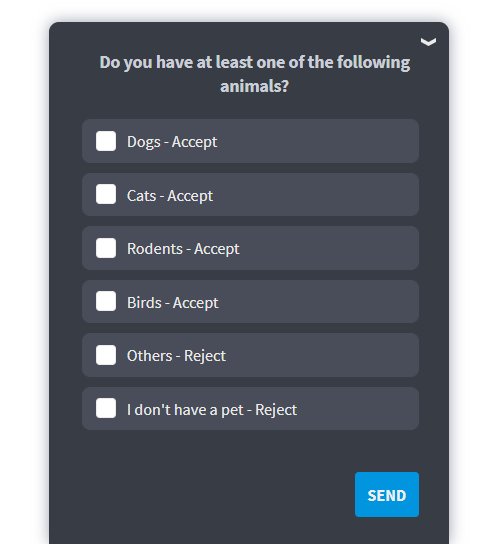
Platforms like UXtweak or Optimal Workshop's Treejack are built specifically for this kind of testing. They give participants a simple, clean interface to click through your text-based tree and automatically record every click and path.
This is a great example of what the participant sees—just a simple, clickable hierarchy. After the study is complete, the tool does the heavy lifting for you, compiling all the data into easy-to-read visualizations. You'll see success rates, how directly people found the answer, and the most common paths they took for each task. This data is exactly what you need to make smart, informed decisions to perfect your navigation.
Making Sense of Your Tree Test Results
The test is over, and now you’re staring at a mountain of data. This is where the real work starts—turning all those raw numbers and click paths into clear, actionable insights. Figuring out what your tree test results actually mean is how you'll fix your information architecture with confidence.
At first, the data can feel a bit overwhelming, but it really just boils down to answering a few core questions. Did people find what they were looking for? How much did they struggle to get there? And where, exactly, did they get lost?

Unpacking the Core Metrics
Most tree testing tools, like Optimal Workshop's Treejack, will spit out a few key quantitative metrics for you. These are the vital signs of your IA’s health, giving you a quick, high-level snapshot of how your navigation is performing.
These numbers tell you the "what" of user behavior. But to truly move the needle on your product, you need to dig into the "why" by combining them with qualitative analysis. If you want to go deeper, our guide on essential usability metrics is a great place to start.
Here’s a quick rundown of the big three metrics you'll be looking at.
Success Rate: This one’s pretty straightforward. It’s simply the percentage of people who correctly found the right answer for a task. A high success rate is a great sign that users are finding what they need.
Directness Score: This tells you how many people completed the task without backtracking. If someone clicks down one path, realizes they made a mistake, and goes back up the tree, that’s an indirect success. A low directness score is a huge red flag that your labels are misleading, even if users eventually stumble upon the right answer.
Time on Task: This tracks how long it took people to finish each task. Be careful with this one, though. A fast time could mean a user was confident, or it could mean they just clicked the first thing that looked remotely plausible. Always look at it alongside success and directness to get the full story.
Key Tree Testing Metrics Explained
To help you get a handle on what these numbers are really telling you, here's a quick breakdown of the most common metrics you'll encounter:
Metric | What It Measures | What It Tells You |
|---|---|---|
Success Rate | The percentage of participants who correctly selected the intended destination. | How effective your structure is at guiding users to the right content. This is your primary measure of findability. |
Directness | The percentage of successful participants who navigated directly to the answer without backtracking. | How intuitive and clear your labels are. Low directness suggests confusion and "pogo-sticking." |
Time on Task | The average time it took participants to complete a task (successfully or not). | The efficiency of your navigation. High times can indicate friction, but context from other metrics is crucial. |
First Click | Where participants first clicked for a given task, regardless of their final answer. | The initial appeal of your top-level categories. It reveals which labels are drawing users in—for better or worse. |
These metrics work together to paint a comprehensive picture. A high success rate is great, but if it comes with low directness and high time on task, you've still got work to do.
Diving into User Path Analysis
Beyond the summary numbers, the real gold is hidden in the user path reports. These are often visualized in a diagram called a "pie-tree" and show you the exact routes every single person took for each task. You can see their first click, where they hesitated, and where they ultimately gave up.
This is how you pinpoint the exact source of confusion. Did 70% of users who failed a task all go down the same wrong path? That’s not a user problem; that's a sign that one of your labels is sending people on a wild goose chase.
By analyzing user paths, you can identify "false scent" trails where a label seems promising but ultimately leads users to the wrong place. Fixing these misleading labels is one of the quickest ways to improve your navigation's clarity.
Let’s say you gave users a task to find "how to integrate a new data source." If half of them click "Settings > Account" instead of the correct path, "Integrations > Add New," you've just found a major findability issue. Maybe "Integrations" needs to be a top-level category, or perhaps it should be cross-listed under "Settings" to meet user expectations.
What Is a Good Score in a Tree Test?
Everyone wants a benchmark, but a "good" score in a tree test is probably lower than you'd expect. Remember, this test strips away all visual design, context, and search functionality, making it inherently harder than using a finished website.
A user who gets a little lost in a text-only tree might find their way instantly on the final interface thanks to helpful icons or layout cues.
In fact, research shows that success rates in tree tests are consistently lower than in full usability studies. For instance, a 67% success rate on a tree test task can often translate to a 90% success rate on the final, designed interface. For more on these benchmarks, you can learn how findability is measured in tree testing.
So, instead of chasing a perfect 100%, focus on patterns and relative performance. Is one task failing way more than the others? Is your new navigation concept outperforming the old one? These comparisons are what give you the evidence to make smart, user-centered decisions that will truly strengthen your product's foundation.
Common Mistakes to Avoid in Tree Testing
A solid tree test can give you crystal-clear insights into whether people can actually find things on your site or app. But a few common pitfalls can easily contaminate your data, sending you down the wrong path and wasting a ton of effort. Getting ahead of these mistakes is the key to running tests that produce reliable, genuinely useful results.
Here are a few to keep in mind:
Writing Leading Task Questions
This is probably the most common and damaging mistake I see. It’s when you write a task that accidentally nudges users toward the right answer because you used the same keywords in the prompt that are in your navigation labels.
When that happens, you're not testing findability anymore—you're just playing a word-matching game.
Let’s say you have a label in your navigation tree called "Manage Subscription."
Bad task: "Where would you go to manage your subscription?" This basically hands them the answer on a silver platter.
Good task: "You need to change the credit card you use for your monthly payment. Where would you look?"
The second version is so much better because it forces the participant to think about their goal, just like they would in real life. They have to interpret your labels to figure out where to go, which gives you a far more realistic picture of how your navigation performs.
"If your task uses the same language as your navigation, you’re not testing findability—you're testing a user's ability to match words. Always frame tasks around a user's goal, not your product's labels."
Recruiting the Wrong Participants

Your test data is only as good as the people you test with. A massive error is recruiting a group of participants who aren’t anything like your actual users. If you're designing a complex AI analytics tool for data scientists, getting feedback from a general audience is going to be wildly misleading.
Their mental models, their vocabulary, their expectations—it’s all different. That kind of mismatch can trick you into "fixing" things that aren't broken for your real audience or, even worse, ignoring the very issues that are making them pull their hair out.
Always use a screener survey: A few quick questions can filter for the right job role, industry, or experience with similar tools.
Target your personas: Make sure the people you test with actually line up with your primary user personas.
Creating Tests That Are Too Long
It's really tempting to try and test every single link and label in one big study, but that's a surefire way to burn out your participants. A tree test that drags on for 15 or 20 tasks will leave people bored, frustrated, and just clicking anything to get it over with.
When fatigue sets in, it poisons your data, especially for the tasks at the end of the test. You'll see success rates plummet and task times skyrocket, not because your navigation is bad, but simply because your participant has checked out.
Stick to a simple rule: keep your tests short and sweet.
Focus on high-priority journeys: Zero in on the tasks that are most critical to your business or the ones you already suspect are problem areas.
Aim for 8-10 tasks maximum: This usually keeps the test under 15 minutes, which is the sweet spot for keeping people engaged and getting quality feedback.
Break it up: If you have more to test, just run multiple smaller tests with different groups of people. It’s a much better approach.
By sidestepping these common blunders, you can be confident that your tree testing is giving you the clean, trustworthy data you need to build a navigation structure that feels genuinely intuitive to your users.
A Real World SaaS Tree Testing Example
To really see how these pieces click together, let's walk through a scenario I see all the time. Imagine a B2B SaaS company with a powerful AI analytics platform. The tool is a beast, but the user feedback is consistent: the navigation is a mess, and new users can't find anything.
The product team knows a redesign is overdue. After a card sorting exercise to understand how users group things, they come up with a much cleaner information architecture. But before they sink a single minute into visual design, they decide to run a tree test to see if their new structure actually works for real people.
Setting Up the Test
First, the team maps out their new navigation as a simple, text-only "tree." No UI, no distractions. It looks something like this:
Home
Dashboard
Analytics
Traffic Analysis
Conversion Funnels
User Behavior
Integrations
Connect Data Source
Manage APIs
Settings
Account Details
Billing & Subscription
Team Members
Next up, they write a handful of tasks. The key here is to make them goal-oriented and to avoid using the exact words from their labels—that would just be a word-matching game. One of their most critical tasks is: "You want to see a pre-built summary of your key performance indicators. Where would you go?" The correct path, in their minds, is the "Dashboard" category.
Analyzing the Results
They run the test with 50 participants who fit their ideal customer profile, and the data starts pouring in. Almost immediately, they spot a huge problem with the task I mentioned. While a few users clicked "Dashboard" correctly, a staggering 62% of them went straight to "Analytics" first.
They were heading down the wrong path entirely, convinced that performance summaries would live under a general analytics bucket. Their first click was wrong, and the directness score for this task was through the floor. This one data point was a massive red flag.
The team was dealing with a classic case of "false scent." The "Analytics" label sounded right, but it led users away from what they were actually looking for. The team realized their terminology was too ambiguous, a common pitfall that tree testing is brilliant at uncovering. This really highlights how critical clear labeling is, a lesson we saw play out in successful projects like the Writesonic website redesign.
The test results were crystal clear: while the team's structure was logical, the labels were failing them. Users mentally lumped "dashboards" and "analytics" together, and the team's attempt to separate them was just causing confusion.
Making a Data-Driven Decision
Armed with this undeniable evidence, the team's path forward was simple. Instead of pushing ahead with the confusing labels, they proposed a small but critical change: rename "Analytics" to "Reports & Analytics" and "Dashboard" to "Dashboards."
This simple tweak, backed by hard data, ended the internal debates on the spot. They had proof that the original labels were misleading. Now, they could move into the UI design phase with confidence, knowing their navigation was built on a foundation that users could actually understand.
FAQs
Tree testing vs. Card sorting: What's the difference?
It’s a classic mix-up. Both tree testing and card sorting deal with information architecture, but they're essentially two sides of the same coin and tackle the problem from opposite directions.
Card sorting is a generative method. You use it at the beginning to build an IA from scratch. You give users a bunch of topics (on "cards") and ask them to group them in a way that makes sense. It’s about discovering your users’ mental models.
Tree testing, on the other hand, is evaluative. You use it to validate an existing or proposed site structure. You've already got the structure, and now you're testing if people can actually find things in it.
How many participants do I need for a tree test?
You'll want to aim for 30 to 50 participants to get solid, reliable quantitative data.
This number hits the sweet spot. It’s large enough to reveal meaningful patterns and pinpoint exactly where users are getting lost in your navigation, but it won’t break your research budget or timeline.
Can I use tree testing for mobile apps?
Absolutely. Tree testing is completely platform-agnostic. It’s a test of the structure, not the pretty UI layered on top of it.
Think about it—the fundamental challenge is the same whether someone is on a giant desktop monitor or a small phone screen. Can they find what they're looking for quickly and easily?
A tree test strips away the visual design and tells you if the underlying menu hierarchy for your mobile app is working as intended.
So, you’ve spent weeks mapping out the navigation for your new B2B SaaS platform. In your head, the structure is perfect—a flawless, logical flow that guides users exactly where they need to go. But here's the tough question: will your users see it that way?
This is where tree testing comes in. Think of it as a way to check the blueprint of your house before you start building. You wouldn't want to find out the only path to the kitchen is through a bedroom after the walls are up, right?
Untangling Your Navigation: What Is Tree Testing in UX?
Tree testing is a UX research method that zeroes in on one thing: the findability of information within your product's structure. It completely ignores the visual design—no colors, no icons, no fancy layouts. It's all about the logic of your information hierarchy.
Imagine handing someone a text-only outline of your website's navigation menu. Then, you give them a simple task, like, "Find where you would update your payment method." You get to watch as they click through the text labels, revealing whether your structure makes sense to a real user. It’s a pure test of your site’s skeleton.
Does "Billing History" belong under "Account Settings" or "Company Profile"? Instead of guessing, tree testing gives you clear, data-backed answers.
Why It's a Game-Changer for SaaS Products
For complex B2B and AI tools, intuitive navigation is everything. If users can't find a feature, it might as well not exist. Tree testing helps you answer mission-critical questions long before a single line of code is written:
Are our labels clear? Do terms like "Integrations," "Workflows," and "Analytics" mean the same thing to our users as they do to us?
Is our content grouped logically? Did we put things where users naturally expect to find them?
Can people find what they need? How quickly and directly can a user complete a key task?
By stripping away the UI, you get raw, unbiased feedback on the underlying logic of your product's navigation. This is the bedrock of strong information architecture in UX.
A Lean, Mean, Insight-Generating Machine
Tree testing isn't new, but it has become a go-to method for a reason. It's fast, effective, and provides hard numbers to guide your decisions. Most tests take just 10 to 15 minutes for a user to complete, making it incredibly easy to find participants and get results quickly.
To put it simply, here are the core components of tree testing.
Tree Testing At a Glance
Aspect | Description |
|---|---|
Primary Goal | To evaluate the findability and logic of an information hierarchy, separate from visual design. |
When to Use It | Early in the design process, before wireframing or visual design begins, or when redesigning existing navigation. |
Key Questions Answered | Are our labels intuitive? Is content grouped correctly? Can users find what they're looking for without getting lost? |
This table shows just how focused this technique is—it's all about validating the "where" before you get bogged down in designing the "how."
In essence, tree testing is like giving someone a map without landmarks. If they can still reach their destination, you know your map's core structure is sound.
This approach ends those endless team debates over navigation. No more relying on opinions or "I think it should go here." You can walk into a meeting with data that shows 75% of users couldn't find the reporting feature because it was buried under a vague "Resources" label. That’s a conversation-ender.
By focusing on structure first, you're embracing the core of what makes navigation work. It also ties directly into broader interactive navigation principles, ensuring the foundation of your user experience is solid from the very start.
When to Use Tree Testing in Your Design Process
In product design, timing is everything. Launching the right test at the right moment can save you from shipping a confusing product and prevent a world of expensive rework down the line. Tree testing has a definite sweet spot in the design process where it delivers the most bang for your buck.
The perfect time to run a tree test is after you've mapped out a proposed information architecture (IA) but before a single wireframe or visual design has been created. This is that critical window where you have a logical structure—maybe one you built from a card sorting exercise—but haven't yet sunk time and resources into building an interface around it.
Think of it like this: card sorting helps you figure out how your users group ideas together. Tree testing then comes in to validate if the navigation structure you built based on those groupings actually works when people try to find things.
Key Moments for SaaS Teams to Tree Test
For anyone building B2B or AI SaaS products, you know how quickly complexity can spiral out of control and overwhelm users. Tree testing isn't just a nice-to-have; it's a strategic necessity for making sure your product’s foundation is solid. Here are a few high-impact scenarios where it really proves its worth.
Validating a Redesigned Navigation
Planning a major overhaul of your main navigation or settings menu? Before you commit, a tree test can confirm whether your new structure is a genuine improvement. You can even test your current IA first to get a baseline score, giving you hard data on which pain points the redesign needs to fix.Integrating a New Feature Set
When you roll out a new batch of features, the biggest risk is that nobody can find them. Where should that new "AI-powered reporting" module live? Does it belong under "Analytics"? Or maybe it needs a new top-level spot called "Insights"? A tree test takes the guesswork out of it, giving you clear data on where users naturally expect it to be.Comparing Different IA Concepts
Sometimes, there are two or more perfectly logical ways to organize your content. Instead of getting stuck in endless debates fueled by team opinions, you can build two different "trees" and run an A/B tree test. Let real user performance data tell you which structure is the winner.
Tree testing transforms subjective arguments about labels and hierarchies into objective, data-driven decisions. It’s the proof you bring to a stakeholder meeting to say, "We tested this—80% of users found the feature here, while only 30% found it over there."
Using Data to Defend Design Choices
One of the best things about tree testing is the clear, quantitative evidence it produces. When a stakeholder asks why a feature is buried three levels deep in a particular menu, you can move past "it just felt right" and confidently say, "our research shows this is the most findable spot." This builds incredible trust in the design process and keeps decisions focused on the user.
This kind of validation is also crucial for bigger company goals. For SaaS companies in a growth spurt, adopting digital transformation best practices is key, and a user-centric approach is non-negotiable. By proving your product's core structure works, you lay a stable foundation for future features, drive adoption, and ultimately improve retention.
To see how tree testing fits into the bigger picture of validation, you can explore other UX research techniques that help create truly user-friendly products.
How to Run a Successful Tree Test?
Jumping into your first tree test is a lot less intimidating than it sounds. If you break the process down into a few clear, manageable stages, you can go from a rough navigation structure to solid, actionable insights pretty quickly.
Let's walk through how to set up and launch a study for your own SaaS product.
The whole point is to create a focused experiment that isolates your information architecture (IA). This way, the feedback you get is purely about your structure and labels—not clouded by visual design or UI elements.
Step 1: Prepare Your "Tree"
First things first, you need to build your "tree." This is just a text-only, hierarchical version of your product's navigation—think of it as the bare-bones skeleton of your sitemap. You don't need fancy design tools for this; a simple spreadsheet or even a bulleted list in a text doc will do the trick.
Start by listing all your top-level navigation items. Then, underneath each one, just indent to show the sub-categories. Keep doing this until you've mapped out every single level of the navigation you want to test.
It's absolutely crucial that the tree you build is an exact match of the IA you're proposing. Any little difference between your test tree and the real structure can skew your results and send you down the wrong path.
The end goal is a clean, text-based hierarchy that people can click through. Most modern testing platforms let you copy and paste this structure right into their tool.
Step 2: Craft Realistic User Tasks
Once your tree is ready, it's time to write the tasks your participants will try to complete. Honestly, this is probably the most critical part of the whole setup. The quality of your tasks directly determines the quality of your data. A great task puts the user in a realistic scenario where they have a specific goal in mind.
A common mistake is using the same words in your task that you use in your navigation labels. For instance, if you have a label called "Subscription Management," a bad task would be "Find where to manage your subscription." That’s not a test of findability; it's just a word-matching game.
Instead, think from the user's point of view:
Weak Task: "Click on Billing Information."
Strong Task: "You just got an email that your monthly invoice is ready. Where would you go to view and download it?"
See the difference? The second one forces people to actually think about their goal and interpret your navigation to find the right path—which is exactly what they do in the real world. Try to stick to a maximum of 10 tasks to keep the test focused and prevent your participants from getting tired or bored.
Step 3: Recruit the Right Participants
Your results are only as good as the people you test with. It's so important to recruit participants who truly represent your target user personas. If you're designing an AI analytics platform for data scientists, getting feedback from marketing managers won't give you the insights you need.
The best way to do this is with a short screener survey. Ask a few questions about their job role, industry, and maybe how familiar they are with similar tools. This little step ensures the people taking your test have the same context and expectations as your actual users.
For your results to be statistically sound, you should aim for at least 30-50 participants for each study. Many testing platforms offer recruitment services, which makes finding qualified people who fit your demographic profile a breeze. If you're looking for the right platform, check out some of the best user testing tools on the market.
Step 4: Launch and Analyze Your Study
Alright, your tree is built, your tasks are written, and your participants are lined up. You're ready to launch! Using a specialized tool for this makes the entire process incredibly smooth.
Platforms like UXtweak or Optimal Workshop's Treejack are built specifically for this kind of testing. They give participants a simple, clean interface to click through your text-based tree and automatically record every click and path.
This is a great example of what the participant sees—just a simple, clickable hierarchy. After the study is complete, the tool does the heavy lifting for you, compiling all the data into easy-to-read visualizations. You'll see success rates, how directly people found the answer, and the most common paths they took for each task. This data is exactly what you need to make smart, informed decisions to perfect your navigation.
Making Sense of Your Tree Test Results
The test is over, and now you’re staring at a mountain of data. This is where the real work starts—turning all those raw numbers and click paths into clear, actionable insights. Figuring out what your tree test results actually mean is how you'll fix your information architecture with confidence.
At first, the data can feel a bit overwhelming, but it really just boils down to answering a few core questions. Did people find what they were looking for? How much did they struggle to get there? And where, exactly, did they get lost?
Unpacking the Core Metrics
Most tree testing tools, like Optimal Workshop's Treejack, will spit out a few key quantitative metrics for you. These are the vital signs of your IA’s health, giving you a quick, high-level snapshot of how your navigation is performing.
These numbers tell you the "what" of user behavior. But to truly move the needle on your product, you need to dig into the "why" by combining them with qualitative analysis. If you want to go deeper, our guide on essential usability metrics is a great place to start.
Here’s a quick rundown of the big three metrics you'll be looking at.
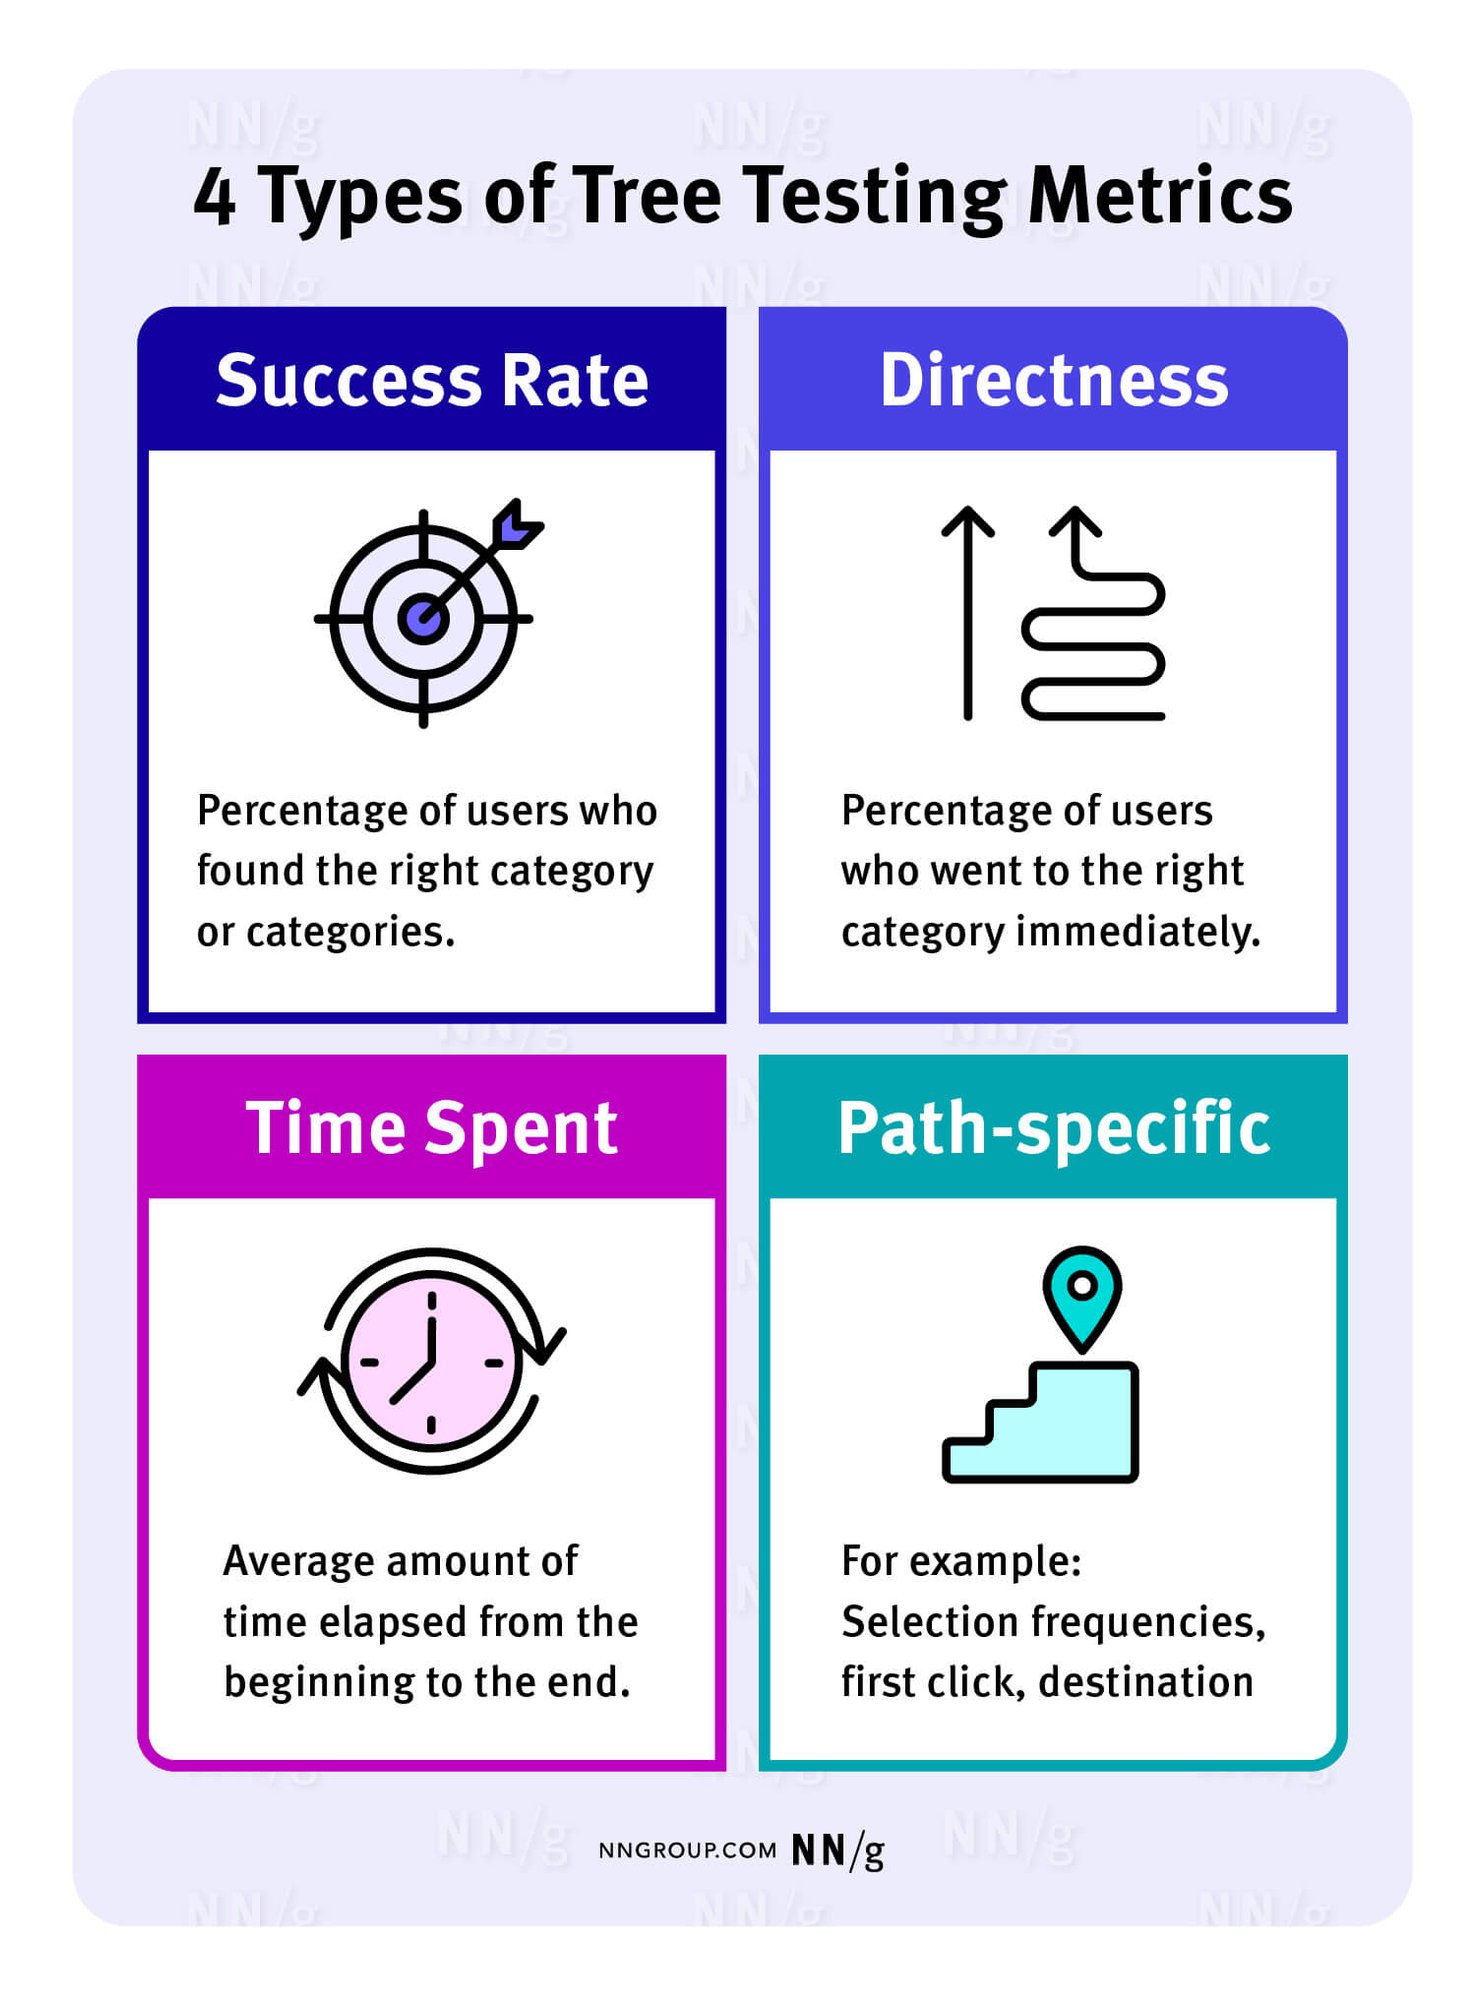
Success Rate: This one’s pretty straightforward. It’s simply the percentage of people who correctly found the right answer for a task. A high success rate is a great sign that users are finding what they need.
Directness Score: This tells you how many people completed the task without backtracking. If someone clicks down one path, realizes they made a mistake, and goes back up the tree, that’s an indirect success. A low directness score is a huge red flag that your labels are misleading, even if users eventually stumble upon the right answer.
Time on Task: This tracks how long it took people to finish each task. Be careful with this one, though. A fast time could mean a user was confident, or it could mean they just clicked the first thing that looked remotely plausible. Always look at it alongside success and directness to get the full story.
Key Tree Testing Metrics Explained
To help you get a handle on what these numbers are really telling you, here's a quick breakdown of the most common metrics you'll encounter:
Metric | What It Measures | What It Tells You |
|---|---|---|
Success Rate | The percentage of participants who correctly selected the intended destination. | How effective your structure is at guiding users to the right content. This is your primary measure of findability. |
Directness | The percentage of successful participants who navigated directly to the answer without backtracking. | How intuitive and clear your labels are. Low directness suggests confusion and "pogo-sticking." |
Time on Task | The average time it took participants to complete a task (successfully or not). | The efficiency of your navigation. High times can indicate friction, but context from other metrics is crucial. |
First Click | Where participants first clicked for a given task, regardless of their final answer. | The initial appeal of your top-level categories. It reveals which labels are drawing users in—for better or worse. |
These metrics work together to paint a comprehensive picture. A high success rate is great, but if it comes with low directness and high time on task, you've still got work to do.
Diving into User Path Analysis
Beyond the summary numbers, the real gold is hidden in the user path reports. These are often visualized in a diagram called a "pie-tree" and show you the exact routes every single person took for each task. You can see their first click, where they hesitated, and where they ultimately gave up.
This is how you pinpoint the exact source of confusion. Did 70% of users who failed a task all go down the same wrong path? That’s not a user problem; that's a sign that one of your labels is sending people on a wild goose chase.
By analyzing user paths, you can identify "false scent" trails where a label seems promising but ultimately leads users to the wrong place. Fixing these misleading labels is one of the quickest ways to improve your navigation's clarity.
Let’s say you gave users a task to find "how to integrate a new data source." If half of them click "Settings > Account" instead of the correct path, "Integrations > Add New," you've just found a major findability issue. Maybe "Integrations" needs to be a top-level category, or perhaps it should be cross-listed under "Settings" to meet user expectations.
What Is a Good Score in a Tree Test?
Everyone wants a benchmark, but a "good" score in a tree test is probably lower than you'd expect. Remember, this test strips away all visual design, context, and search functionality, making it inherently harder than using a finished website.
A user who gets a little lost in a text-only tree might find their way instantly on the final interface thanks to helpful icons or layout cues.
In fact, research shows that success rates in tree tests are consistently lower than in full usability studies. For instance, a 67% success rate on a tree test task can often translate to a 90% success rate on the final, designed interface. For more on these benchmarks, you can learn how findability is measured in tree testing.
So, instead of chasing a perfect 100%, focus on patterns and relative performance. Is one task failing way more than the others? Is your new navigation concept outperforming the old one? These comparisons are what give you the evidence to make smart, user-centered decisions that will truly strengthen your product's foundation.
Common Mistakes to Avoid in Tree Testing
A solid tree test can give you crystal-clear insights into whether people can actually find things on your site or app. But a few common pitfalls can easily contaminate your data, sending you down the wrong path and wasting a ton of effort. Getting ahead of these mistakes is the key to running tests that produce reliable, genuinely useful results.
Here are a few to keep in mind:
Writing Leading Task Questions
This is probably the most common and damaging mistake I see. It’s when you write a task that accidentally nudges users toward the right answer because you used the same keywords in the prompt that are in your navigation labels.
When that happens, you're not testing findability anymore—you're just playing a word-matching game.
Let’s say you have a label in your navigation tree called "Manage Subscription."
Bad task: "Where would you go to manage your subscription?" This basically hands them the answer on a silver platter.
Good task: "You need to change the credit card you use for your monthly payment. Where would you look?"
The second version is so much better because it forces the participant to think about their goal, just like they would in real life. They have to interpret your labels to figure out where to go, which gives you a far more realistic picture of how your navigation performs.
"If your task uses the same language as your navigation, you’re not testing findability—you're testing a user's ability to match words. Always frame tasks around a user's goal, not your product's labels."
Recruiting the Wrong Participants
Your test data is only as good as the people you test with. A massive error is recruiting a group of participants who aren’t anything like your actual users. If you're designing a complex AI analytics tool for data scientists, getting feedback from a general audience is going to be wildly misleading.
Their mental models, their vocabulary, their expectations—it’s all different. That kind of mismatch can trick you into "fixing" things that aren't broken for your real audience or, even worse, ignoring the very issues that are making them pull their hair out.
Always use a screener survey: A few quick questions can filter for the right job role, industry, or experience with similar tools.
Target your personas: Make sure the people you test with actually line up with your primary user personas.
Creating Tests That Are Too Long
It's really tempting to try and test every single link and label in one big study, but that's a surefire way to burn out your participants. A tree test that drags on for 15 or 20 tasks will leave people bored, frustrated, and just clicking anything to get it over with.
When fatigue sets in, it poisons your data, especially for the tasks at the end of the test. You'll see success rates plummet and task times skyrocket, not because your navigation is bad, but simply because your participant has checked out.
Stick to a simple rule: keep your tests short and sweet.
Focus on high-priority journeys: Zero in on the tasks that are most critical to your business or the ones you already suspect are problem areas.
Aim for 8-10 tasks maximum: This usually keeps the test under 15 minutes, which is the sweet spot for keeping people engaged and getting quality feedback.
Break it up: If you have more to test, just run multiple smaller tests with different groups of people. It’s a much better approach.
By sidestepping these common blunders, you can be confident that your tree testing is giving you the clean, trustworthy data you need to build a navigation structure that feels genuinely intuitive to your users.
A Real World SaaS Tree Testing Example
To really see how these pieces click together, let's walk through a scenario I see all the time. Imagine a B2B SaaS company with a powerful AI analytics platform. The tool is a beast, but the user feedback is consistent: the navigation is a mess, and new users can't find anything.
The product team knows a redesign is overdue. After a card sorting exercise to understand how users group things, they come up with a much cleaner information architecture. But before they sink a single minute into visual design, they decide to run a tree test to see if their new structure actually works for real people.
Setting Up the Test
First, the team maps out their new navigation as a simple, text-only "tree." No UI, no distractions. It looks something like this:
Home
Dashboard
Analytics
Traffic Analysis
Conversion Funnels
User Behavior
Integrations
Connect Data Source
Manage APIs
Settings
Account Details
Billing & Subscription
Team Members
Next up, they write a handful of tasks. The key here is to make them goal-oriented and to avoid using the exact words from their labels—that would just be a word-matching game. One of their most critical tasks is: "You want to see a pre-built summary of your key performance indicators. Where would you go?" The correct path, in their minds, is the "Dashboard" category.
Analyzing the Results
They run the test with 50 participants who fit their ideal customer profile, and the data starts pouring in. Almost immediately, they spot a huge problem with the task I mentioned. While a few users clicked "Dashboard" correctly, a staggering 62% of them went straight to "Analytics" first.
They were heading down the wrong path entirely, convinced that performance summaries would live under a general analytics bucket. Their first click was wrong, and the directness score for this task was through the floor. This one data point was a massive red flag.
The team was dealing with a classic case of "false scent." The "Analytics" label sounded right, but it led users away from what they were actually looking for. The team realized their terminology was too ambiguous, a common pitfall that tree testing is brilliant at uncovering. This really highlights how critical clear labeling is, a lesson we saw play out in successful projects like the Writesonic website redesign.
The test results were crystal clear: while the team's structure was logical, the labels were failing them. Users mentally lumped "dashboards" and "analytics" together, and the team's attempt to separate them was just causing confusion.
Making a Data-Driven Decision
Armed with this undeniable evidence, the team's path forward was simple. Instead of pushing ahead with the confusing labels, they proposed a small but critical change: rename "Analytics" to "Reports & Analytics" and "Dashboard" to "Dashboards."
This simple tweak, backed by hard data, ended the internal debates on the spot. They had proof that the original labels were misleading. Now, they could move into the UI design phase with confidence, knowing their navigation was built on a foundation that users could actually understand.
FAQs
Tree testing vs. Card sorting: What's the difference?
It’s a classic mix-up. Both tree testing and card sorting deal with information architecture, but they're essentially two sides of the same coin and tackle the problem from opposite directions.
Card sorting is a generative method. You use it at the beginning to build an IA from scratch. You give users a bunch of topics (on "cards") and ask them to group them in a way that makes sense. It’s about discovering your users’ mental models.
Tree testing, on the other hand, is evaluative. You use it to validate an existing or proposed site structure. You've already got the structure, and now you're testing if people can actually find things in it.
How many participants do I need for a tree test?
You'll want to aim for 30 to 50 participants to get solid, reliable quantitative data.
This number hits the sweet spot. It’s large enough to reveal meaningful patterns and pinpoint exactly where users are getting lost in your navigation, but it won’t break your research budget or timeline.
Can I use tree testing for mobile apps?
Absolutely. Tree testing is completely platform-agnostic. It’s a test of the structure, not the pretty UI layered on top of it.
Think about it—the fundamental challenge is the same whether someone is on a giant desktop monitor or a small phone screen. Can they find what they're looking for quickly and easily?
A tree test strips away the visual design and tells you if the underlying menu hierarchy for your mobile app is working as intended.


Similar Blogs
Similar Blogs
Similar Blogs


Available for Work
Bricx
© Bricx, 2026. All rights reserved.


Available for Work
Bricx
© Bricx, 2026. All rights reserved.
Available for Work
Bricx
© Bricx, 2026. All rights reserved.
Available for Work
Bricx
© Bricx, 2026. All rights reserved.